Data Intelligence for Utilities
Utility companies face quite a few challenges today from maintaining infrastructure, combatting natural events, tackling a host of competitors sprung from deregulation, to being one of the main targets for cyber attacks. InetSoft's business intelligence tool can be a main weapon to win the battles.
A Powerful Analytics Tool for the Utility Industry
Nowadays more and more data is collected than can be easily analyzed with traditional analytical tools. Daily operational dashboards become outdated when they cannot be easily updated or connect to new data.
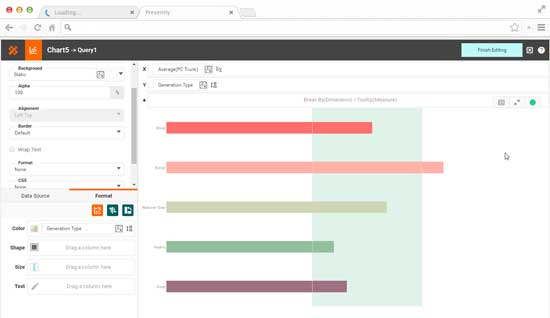
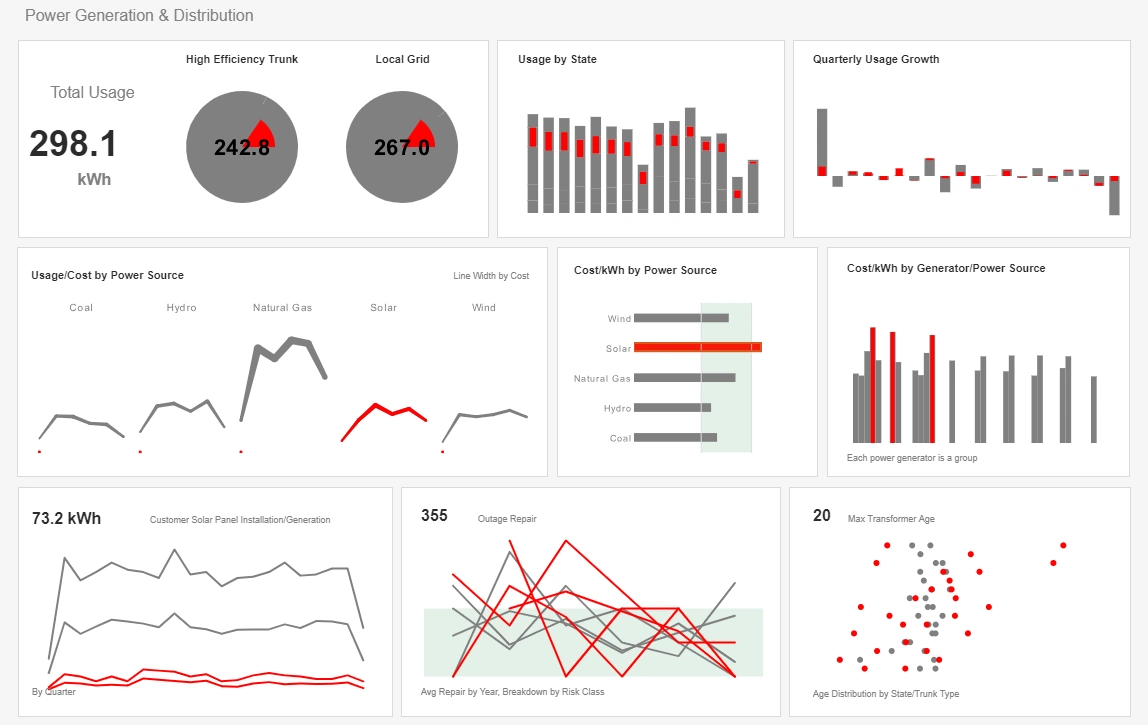
InetSoft's business intelligence software offers the ability to create wide-ranging reports, attractive visual utility dashboards and real-time interactive dashboards. The interactive dashboard shown is just one example of how data can be used to visualize essential information.

Examples of Utility Industry BI Applications
Interactive dashboards can provide management with up-to-the-minute information, with data directly connected to reporting and constantly updating the visual, as opposed to traditional reports run by IT on a regular basis for decision-making purposes. Predictive analytics is another area in which business intelligence can benefit utility companies.
For example, predictive analytics can be used in planning for a major storm by looking at similar past outages and understanding the root causes. Finding might lead to pro-active clearing branches or having repair crews ready. Other analytical applications include scheduling preventive maintenance of plants based on past records or understanding customer interactions and behavior in order to improve customer service and satisfaction, thus reducing call volumes in call centers.
Reasons Why Organizations Choose InetSoft

"Using Style Scope from InetSoft gave us the ability to provide a graphical representation of the
key
data to top management right 'out-of-the-box' and move from static tables of numbers to charts and
graphics
that are much easier to understand."
- Sergio R.
"I spent months looking for the best dashboard/reporting app to suit my business. I literally tried and tested every application out there and I have to say that the StyleBI App is by far the best. It is simple to use and it is absolutely brilliant if you are needing dashboards on custom objects." - Jacki A.
Other BI Applications in the Utility Industry
- Business monitoring
- Employee retention
- General administration
- Customer aquisition
- Load monitoring
- Efficiency analysis
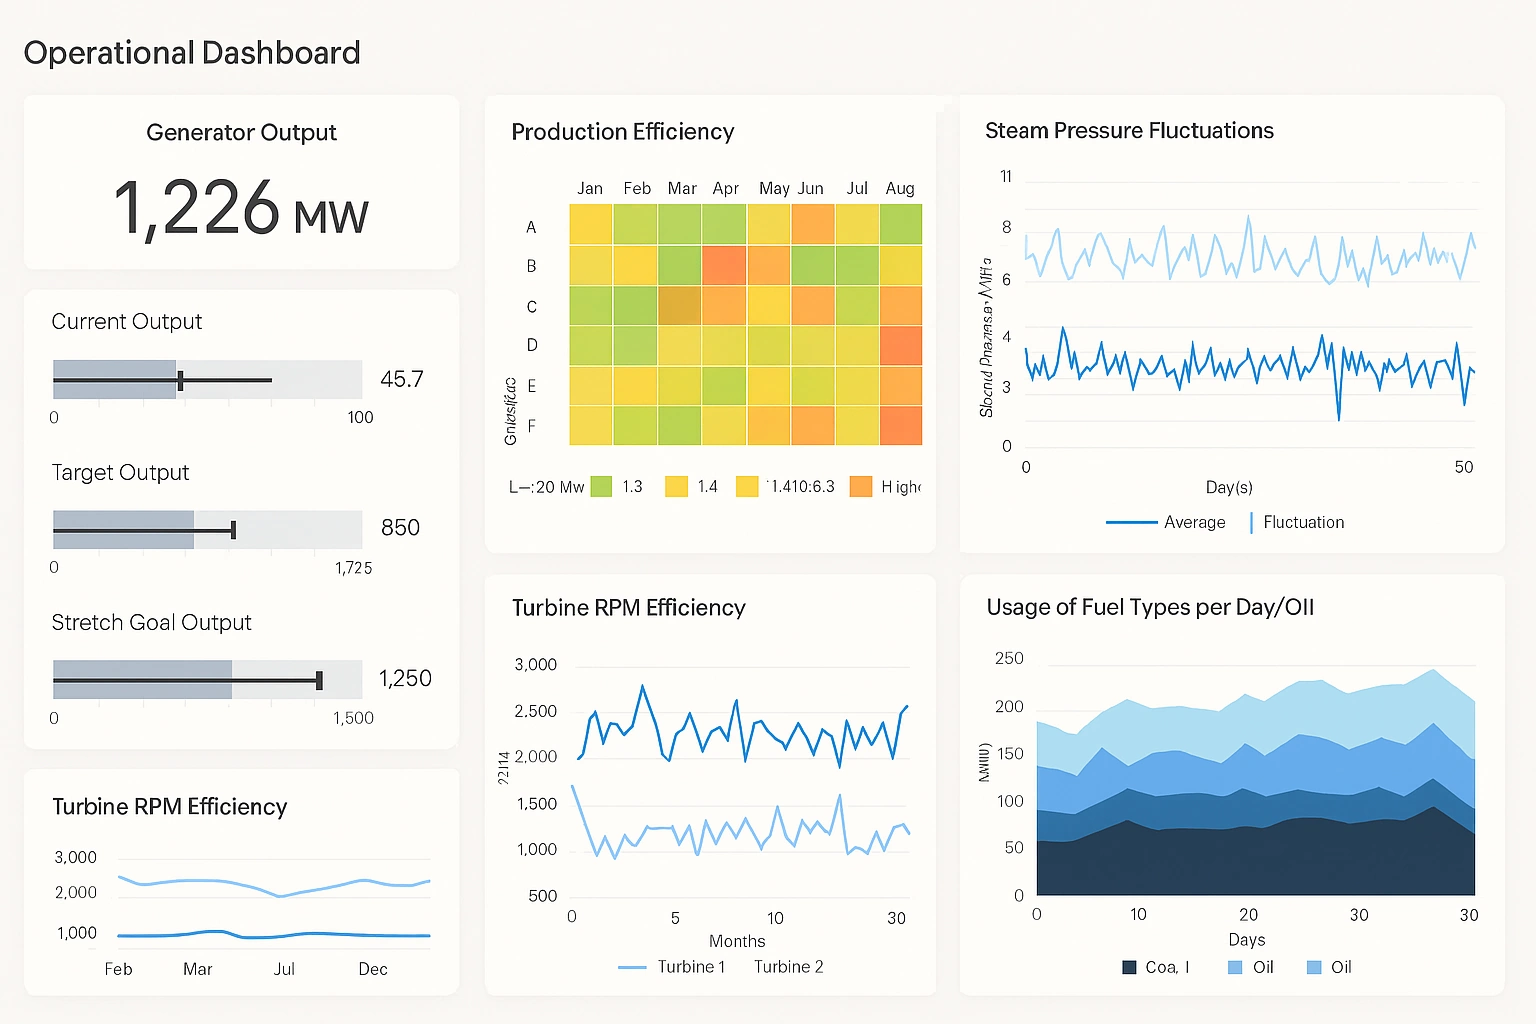
Metrics Tracked on Operational Dashboards of a Nuclear Power Generator
Operational dashboards in a nuclear power generation facility serve as the central interface for monitoring, managing, and optimizing plant performance. Unlike executive or financial dashboards, operational dashboards are designed to provide real-time, actionable insights for engineers, operators, and maintenance teams. They aggregate data from sensors, control systems, and enterprise resource planning systems to present a clear view of plant health, safety, efficiency, and regulatory compliance. Understanding the metrics on these dashboards is critical not only for operational excellence but also for ensuring the safety and reliability of the nuclear power plant.
Reactor and Core Performance Metrics
1. Reactor Power Level
The reactor power level indicates the current energy output relative to the design capacity, typically expressed as a percentage of full power. Monitoring power levels ensures the reactor operates within safe limits and optimizes electricity generation. Operators can influence this metric by adjusting control rod positions, managing coolant flow, and following load demand requirements. Maintaining stable power levels reduces stress on reactor components and improves fuel utilization efficiency.
2. Core Temperature
Core temperature tracks the heat within the reactor core, which is critical for safe operations. Excessive temperatures can lead to fuel damage, while low temperatures may reduce operational efficiency. Operators affect this metric through coolant flow rate adjustments, control rod positioning, and steam generation management. Automated alarms and predictive models often alert teams to temperature deviations before they reach critical thresholds.
3. Neutron Flux and Reactor Kinetics
Neutron flux measures the intensity of neutron activity in the core, which directly relates to the rate of nuclear fission. Reactor kinetics metrics, including reactivity and flux distribution, help operators assess stability and identify potential hot spots. Controlling neutron flux involves adjusting control rods, using burnable absorbers, and managing fuel loading patterns. Accurate monitoring ensures safe, sustained fission and prevents localized overheating or underperformance.
Thermal and Coolant System Metrics

4. Coolant Flow Rate
The coolant flow rate indicates how much water or other coolant circulates through the reactor core. Proper flow is essential to remove heat efficiently and prevent overheating. Operators can affect this metric by adjusting pump speeds or valve positions. Monitoring coolant flow also supports early detection of blockages, pump malfunctions, or leaks that could compromise safety and performance.
5. Steam Pressure and Temperature
Steam pressure and temperature metrics reflect the conditions in the secondary loop where heat from the reactor is converted to mechanical energy in turbines. Maintaining optimal steam conditions maximizes turbine efficiency and electricity generation. Adjustments to heat exchangers, turbine valves, and feedwater systems allow operators to control these metrics. Deviations may indicate scaling, condensation issues, or turbine inefficiencies that need attention.
6. Heat Transfer Efficiency
Heat transfer efficiency tracks how effectively the thermal energy from the reactor is transferred to the secondary loop. Reduced efficiency can signal fouling, corrosion, or suboptimal flow patterns. Operators can influence this metric by performing preventive maintenance, optimizing coolant chemistry, and monitoring exchanger performance. High efficiency ensures maximum energy extraction from fuel and reduces operational costs.

Electrical Output and Grid Metrics
7. Electrical Output
Electrical output measures the real-time generation of electricity delivered to the grid. Operators monitor this metric to ensure consistent supply and respond to grid demand fluctuations. Adjusting reactor power, turbine settings, or transformer configurations affects output levels. Maintaining stable output supports grid reliability and fulfills contractual obligations with utility providers.
8. Power Factor and Voltage Regulation
Power factor indicates how effectively electrical power is converted into useful work, while voltage regulation measures stability of voltage delivered to the grid. Poor power factor or voltage instability can lead to inefficiencies and penalties from grid operators. Operators can influence these metrics through generator excitation controls, capacitor banks, and reactive power compensation. Monitoring these metrics ensures compliance with grid codes and protects equipment from stress.
Safety and Regulatory Metrics
9. Radiation Levels
Radiation metrics monitor ambient radiation within the plant and around critical systems. Elevated readings may indicate leaks, shielding failures, or containment issues. Operators affect radiation levels by ensuring proper shielding, maintaining containment integrity, and following strict operational protocols. Continuous monitoring is essential for worker safety and regulatory compliance.
10. Containment Pressure and Integrity
Containment pressure metrics track the conditions within the reactor building designed to prevent radioactive release. Pressure deviations can signal leaks, system malfunctions, or emergency conditions. Operators manage this metric through ventilation controls, isolation valves, and emergency systems. Maintaining containment integrity is critical for safety and environmental protection.
11. Emergency System Status
This metric monitors the readiness of backup systems, such as emergency cooling, power supply, and shutdown mechanisms. Any failure or maintenance requirement is flagged for immediate attention. Operators influence this metric through regular testing, maintenance, and adherence to safety protocols. Reliable emergency systems are vital to prevent accidents and meet regulatory standards.

Operational Efficiency and Maintenance Metrics
12. Equipment Utilization
Equipment utilization metrics track the operational status and load of pumps, turbines, and auxiliary systems. Over- or under-utilization can indicate inefficiencies or potential wear. Operators can optimize utilization through load balancing, preventive maintenance, and operational scheduling. Proper utilization reduces downtime and prolongs equipment life.
13. Unplanned Downtime
This metric measures the duration and frequency of unplanned shutdowns or equipment failures. Reducing downtime is crucial for both safety and financial performance. Operators and maintenance teams can minimize unplanned downtime by analyzing failure trends, implementing predictive maintenance, and ensuring timely inspections. A low unplanned downtime metric indicates stable and reliable operations.
14. Maintenance Backlog
Maintenance backlog tracks the number of deferred or pending maintenance tasks. A high backlog can signal operational risk and potential regulatory concerns. Addressing backlog involves resource allocation, preventive maintenance scheduling, and prioritizing critical systems. Keeping backlog low ensures safety, compliance, and uninterrupted power generation.
Fuel and Resource Metrics
15. Fuel Burn Rate
Fuel burn rate measures how quickly nuclear fuel is consumed relative to planned usage. This metric affects operational cost, refueling schedules, and reactor stability. Operators influence fuel burn through reactor power adjustments, control rod management, and operational planning. Monitoring burn rates allows efficient fuel utilization and planning for refueling outages.
16. Coolant Chemistry and Purity
Coolant chemistry metrics track pH, dissolved oxygen, and other chemical properties essential for preventing corrosion, scaling, and radiation contamination. Deviations can affect reactor longevity and safety. Operators control chemistry through chemical dosing, filtration systems, and regular sampling. Maintaining optimal coolant conditions ensures safe and efficient heat transfer.

How to Affect Operational Metrics
Operational metrics on nuclear dashboards are not static; they can be influenced by proactive management, process optimization, and continuous monitoring. Strategies to affect metrics include:
- Real-Time Monitoring: Continuous data collection and automated alerts allow operators to respond quickly to deviations, minimizing risks and optimizing performance.
- Preventive and Predictive Maintenance: Analyzing historical performance and failure patterns helps schedule maintenance before problems occur, reducing unplanned downtime.
- Operator Training and Procedures: Skilled operators following established procedures ensure consistent control over reactor power, coolant systems, and safety mechanisms.
- Equipment Optimization: Balancing loads, adjusting control parameters, and maintaining auxiliary systems ensures efficient utilization and prolongs equipment life.
- Data-Driven Decision Making: Using historical trends and predictive models allows proactive adjustments to fuel use, thermal efficiency, and grid output.
- Regulatory Compliance: Following safety and environmental regulations ensures containment, radiation, and emergency systems operate as required.
- Continuous Improvement: Reviewing dashboard insights, conducting root cause analysis, and refining processes lead to incremental improvements in efficiency, safety, and output.