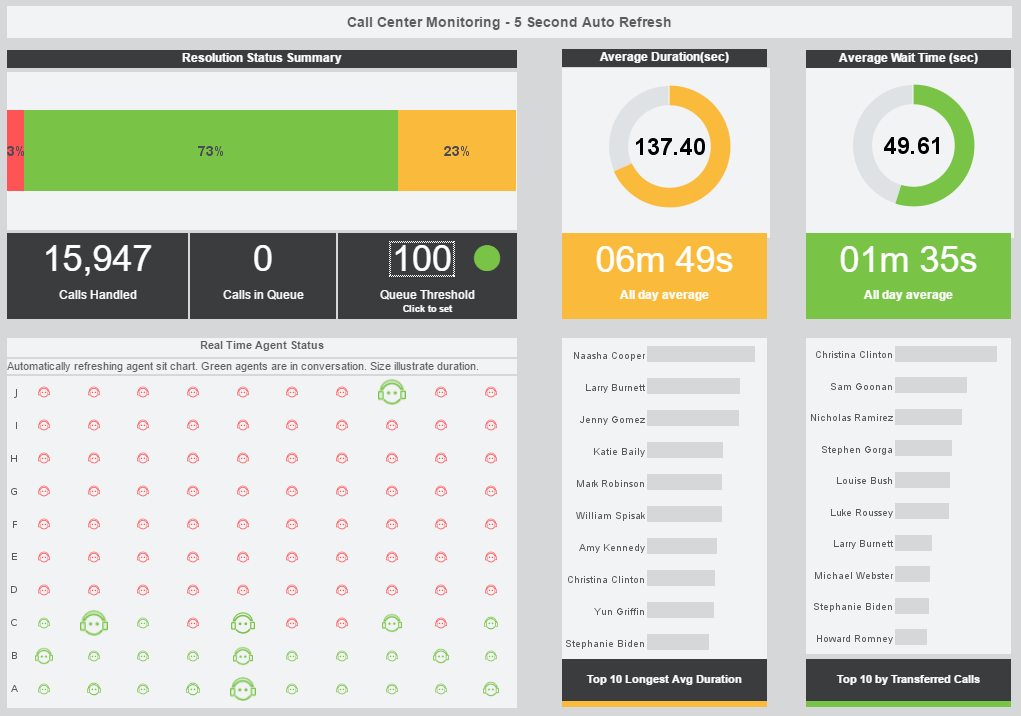
Interested in viewing live interactive examples of visualization dashboards? These interactive dashboards allow you to get a feel for how easy it to use InetSoft’s visualization software. Click on an image to demo an interactive visualization. Posted byBen Williams October 25, 2022 Tags:dashboard examples, data visualizations 1 Share: Related Articles How Semiotics Can Help You Design Better Reports and Dashboards: Part 3 Are performance metric dashboards a good fit? InetSoft’s Pharmaceutical Testing Dashboard What Are the Main Advantages of KPI Reporting Dashboards? Mining Industry Dashboards Department Dashboard Examples