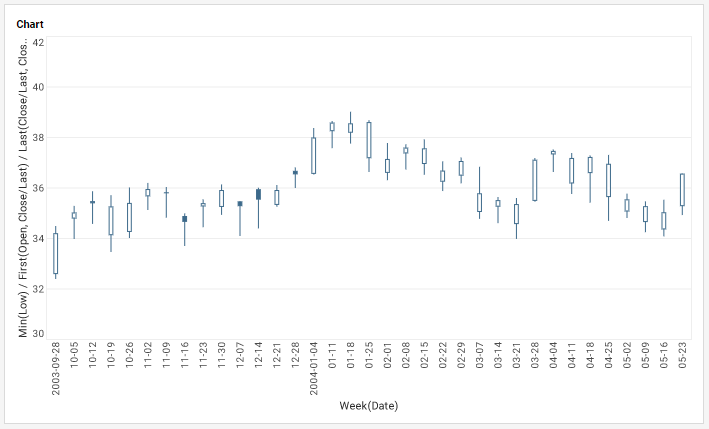
This page discusses the uses of Candlestick charts, and explains how you can create them in both Google Sheets and InetSoft. This page also provides access to a free online tool for creating Candlestick charts and complete functioning BI dashboards. Posted byBen Williams January 19, 2023 Tags:candlestick charts, training 1 Share: Related Articles FinTech Benefits from Analytics Dashboards and Analytics for Google Search Console Is Self-Service BI too hard for business users? Laying out a dashboard for mobile devices Dashboards and Analytics for Google Search Console Contour Charts – Definition, Example, and How to Make Them