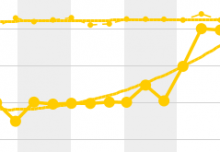
In previous posts we’ve discussed how certain dashboard design examples are best for certain types of data. Continuing with this theme, let’s discuss dashboard design tips for plotting time series vs other kinds of dimensions. Since a time series is a dimension, it can be plotted any way that other dimensions are, however, it’s worth thinking about how some chart styles suggest the passage of time but others do not. To illustrate this, let’s start by asking ourselves, what’s wrong with the chart shown below?
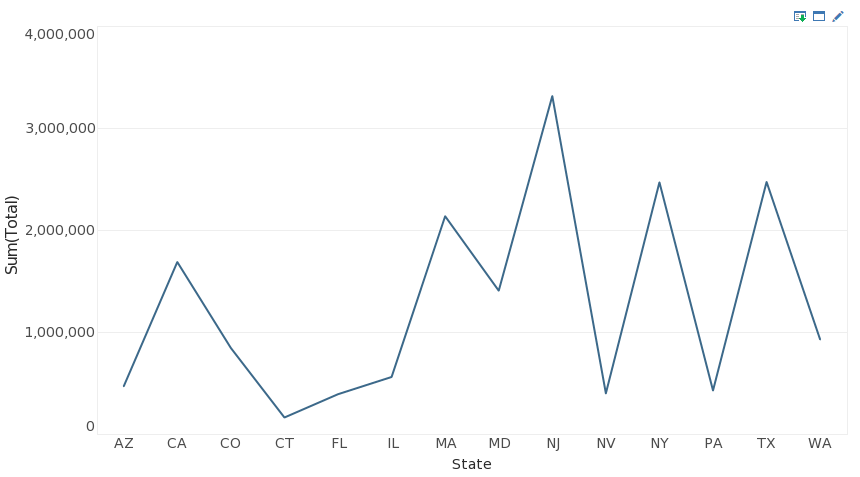
Technically speaking, nothing is wrong here. But using a line chart to visualize state by state totals is very misleading. Each individual data point is connected to the next with a line segment, suggesting some kind of connection from one state to the next. This is what causes a line chart to imply the passage of time, even if the line chart is not actually showing a time series. As you can see below, an area chart has a similar effect.
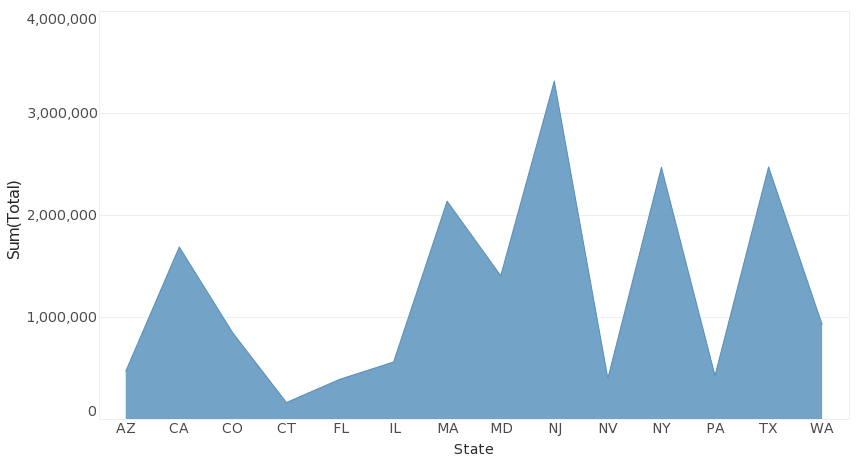
Once again, the unbroken flow from one distinct category to the next suggests a time series where there is none. So a best practice would be to depict time series as line or area charts (as shown below) and stick to other chart types for category dimensions.

Keep following The Mashup for tips on using visualization software to make your dashboards more clear and communicative.