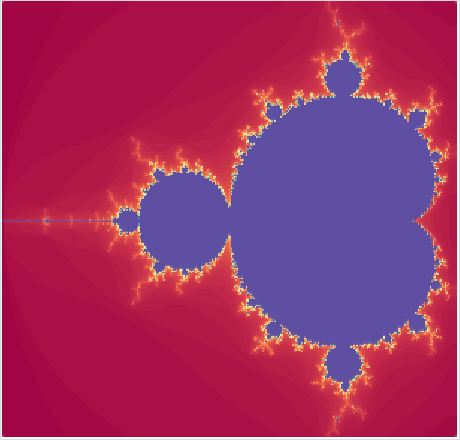
This page explains how you can create fractal charts such as the Mandelbrot Set in both Google Sheets and InetSoft. This page also provides access to a free online tool for creating charts and complete functioning business intelligence dashboards. Posted byBen Williams March 2, 2023 Tags:fractal charts, Mandelbrot Set, training 1 Share: Related Articles Connect to Operational Data Sources What KPIs Are Used in Grant Management Dashboards? Different Types of KPIs Definition of a Jump Line Chart What Is a Cash Management Dashboard? Definition of a Map With Path