Five Tips on How Analytics and Data Can Be Useful for e-Commerce Owners
In the early days of eCommerce, the first retailers had to overcome a great challenge of convincing customers to trust them. Giving out credit card numbers and personal details online was something that many didn't really trust, so Amazon and other retailers had to do a great job to get the public put their faith into this new way to pay and shop.
As customers have gotten super comfortable with shopping online, the eCommerce industry proliferated. Today, online retailers have to face yet another profound problem: the diversity of customer choice. While this may not sound like an issue at all, giving too much choice and too little assistance and guidance can:
- easily confuse customers and make them leave the site
- convince them to put off the purchase
- look for a product on a competitor's site
- visit a brick and mortar store instead.

Fortunately, eCommerce sellers can overcome this challenge by taking advantage of data analytics that predicts what a customer wishes to buy and simply the task of making a choice. For example, Amazon's product recommendation engine that studies browsing and purchase history to generate recommendations is responsible for 35 percent of the company's total sales. That's about $25 billion.
In this article, let's talk about other ways in which eCommerce sellers can use data analytics to increase sales. Let's start by discussing the problem of the diversity of customer choice in more detail.
1. Provide a Personalized Shopping Experience
It goes without saying that the eCommerce industry is booming and the choice it gives to customers is unprecedented. Nowadays, you can buy everything you need online, and there will be at least a few options to buy from. According to estimates, there are almost one million eCommerce stores in the U.S. alone, and this number triples on a global scale.
With the range of products increasing every day, too, eCommerce customer experience lacked any personal touch. For example, customers had to go through numerous product pages and highlight those they were interested in, which isn't exactly user-friendly.
On the other hand, data analytics based on the analysis of customer browsing history and purchasing history. For example, it's now possible to track products that a customer had visited, and send them personalized recommendations by email and show these products the next time they visit the website again.
And doing so is really effective, as the Amazon recommendation engine's results showed.

2. Real-Time (Dynamic) Pricing
Powerful eCommerce pricing software allows sellers to manage prices based on real-time competitor data, which can improve profitability. In fact, this Deloitte report says that effective price management in eCommerce can increase "a company's margins by 2 to 7 percent" within one year, thus producing the return on investment between 200 and 350 percent.
Simply explained, dynamic pricing occurs when an eCommerce seller changes online prices very quickly based on a range of sales factors. These include customer purchasing history, prices of competitors, and stock availability of high-demand products.
WalMart, one of the companies using real-time pricing software, is known to change its prices about 50,000 times a month, and its total sales increased by 30 percent after the introduction of the strategy.
A simple example of dynamic pricing is changing the price of a product to make it lower than competitors' so the customers know they don't need to visit more sites to make a good buy.

3. Advanced Customer Analysis
Having a good understanding of customers is essential for personalizing their experience, increasing their loyalty, and getting more purchases from them. Every eCommerce business sits on tons of customer-related data, and data analytics tools can help to finally put them to good use.
For example, this data can reveal customer preferences, demand spikes, trends, typical buying times, and other important factors. Real-time sales reports in CRM systems are great tools in this regard because they can be used to cover the whole customer journey.
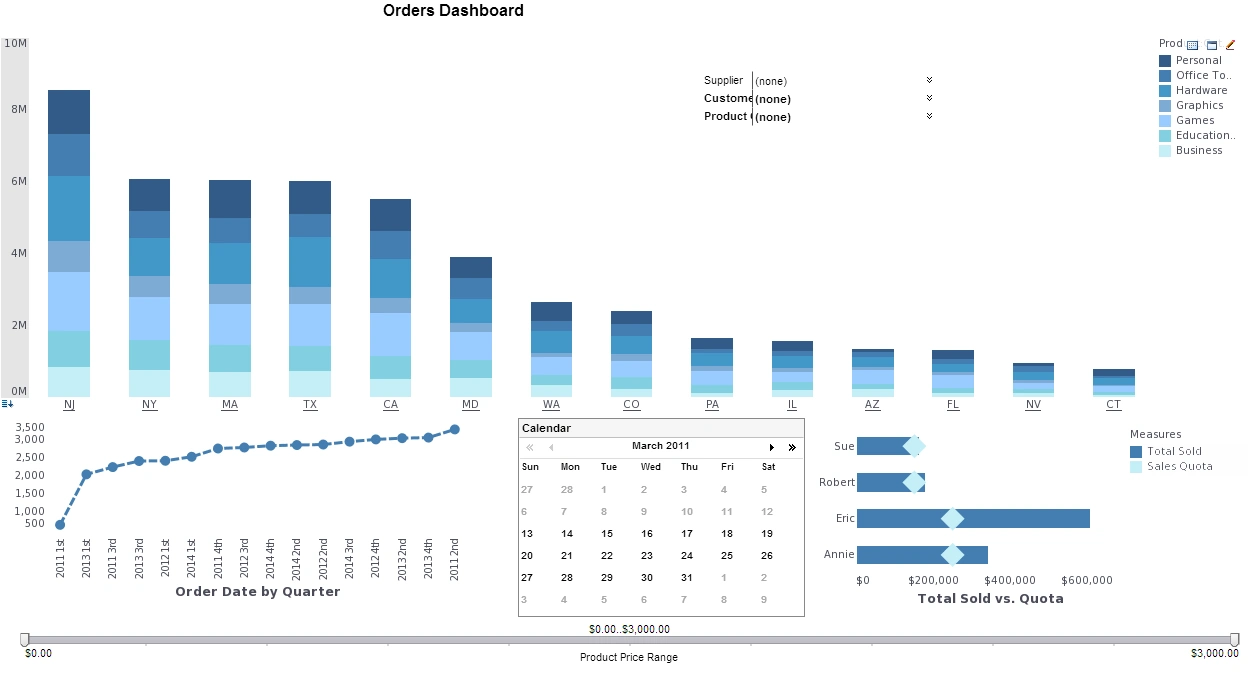
If you'd like to see what a real-time sales report looks like, feel free to interact with a Live Sales Dashboard.
4. Improving Customer Service
This one is related to the previous one because customer service is a part of the holistic understanding of customers. The problem of poor customer support is well-known in eCommerce (while the exact number of losses due to poor customer service in eCommerce is extremely hard to define, there are reports suggesting losses up to $75 billion annually).
By analyzing big data, eCommerce sellers can come up with more effective customer support strategies and replace those not making the necessary effect. For example, the analysis essentially puts a seller into a customer's shoes because it provides information about their preferences, needs, and buying habits.
A lot of things can be better understood when eCommerce companies begin using customer-related data analytics. For example, by studying a customer's purchase and product return histories, one can reveal what logistics and customer service problems exist that affect the outcome of the sales.
5. Optimize Product Discovery with Intelligent Search Analytics
Many e‑commerce stores underestimate how much revenue is lost simply because customers cannot find what they are looking for. Search bars, filters, and category navigation generate a wealth of behavioral data that can be analyzed to reveal friction points in product discovery. By studying search queries, zero‑result searches, filter combinations, and abandonment patterns, retailers can identify where customers struggle and which products should be surfaced more prominently. Machine‑learning‑driven search tuning—such as boosting popular items, correcting misspellings, or auto‑suggesting relevant categories—helps customers reach desired products faster and reduces frustration. With InetSoft’s analytics layer, these insights can be visualized in real time, enabling e‑commerce teams to continuously refine search performance and convert more browsing sessions into purchases.
Industry KPI Articles
-
Conversion Rate Customer Acquisition Cost Metrics
This article explains why online stores should track more than top-line revenue when evaluating performance. It lays out nine core KPIs, including conversion rate, customer acquisition cost, average order value, customer lifetime value, retention rate, and cart abandonment. The write-up shows how each metric reveals a different stage of the buyer journey, from initial visit to repeat purchase. It also highlights how combined KPI monitoring helps teams pinpoint friction in checkout and optimize campaign spend. The overall takeaway is that balanced KPI tracking produces steadier growth than relying on a single sales number.
-
Essential Healthcare KPIs Visualizations
This piece focuses on the metrics healthcare leaders use to manage quality, capacity, and cost pressures. It describes how KPI dashboards help teams monitor patient demand, operational throughput, and service outcomes in one place. The article emphasizes that visual monitoring makes it easier to detect issues early and coordinate corrective action across departments. It also connects KPI visibility with predictive planning, so administrators can allocate staff and resources more effectively. The central message is that healthcare organizations improve decisions when critical indicators are presented clearly and continuously.
-
Pull Through Rate Approval Ratio Cycle Time
This article outlines the most important measurements for consumer lending teams managing application pipelines. It covers pull-through rate, approval rate, loan cycle time, and incomplete application rate as key indicators of process health. The discussion shows how these KPIs reveal bottlenecks that slow funding and reduce borrower satisfaction. It also explains that faster, cleaner workflows can improve competitiveness in markets where borrowers expect quick decisions. The final insight is that a well-structured dashboard turns scattered lending metrics into operational priorities teams can act on immediately.
-
Liquidity Forecast Daily Cash Position Tracking
This article describes cash management dashboards as tools for monitoring a company’s short-term financial resilience. It explains how real-time visibility into inflows, outflows, and liquidity supports better treasury decisions. The article notes that organizations with complex structures especially benefit from consolidated daily cash position tracking. It also highlights how forecast comparisons help finance teams anticipate constraints before they become urgent. The practical conclusion is that cash KPI monitoring improves control, planning confidence, and response speed.
-
Grant Spending Compliance Milestone KPI Tracking
This article addresses the accountability demands organizations face after receiving grant funding. It explains how dashboards bring financial, compliance, and program progress indicators together in a single monitoring view. The piece stresses that consistent KPI tracking helps teams detect misuse risk, reporting gaps, and schedule slippage early. It also recommends integrating grant dashboards with surrounding systems to improve traceability and audit readiness. The main point is that disciplined KPI oversight helps grant recipients protect funding outcomes and maintain sponsor trust.
-
Time To Hire Candidate Funnel Metrics
This guide explains how recruiting teams use KPI dashboards to optimize hiring operations. It covers core indicators such as time-to-hire, pipeline movement, source effectiveness, and related process quality measures. The article shows that dashboarding improves visibility into where candidate flow slows or drops off. It also emphasizes the role of KPI context, since results can be influenced by role type, market conditions, and internal constraints. The broader conclusion is that recruitment performance improves when teams track the right metrics consistently and act on trend shifts quickly.
-
Turnover Absence Employee Satisfaction Benchmarks
This article details the KPI mix HR operations analysts use to evaluate workforce health and productivity. It includes turnover, absenteeism, benefits satisfaction, internal promotion, and sentiment-oriented measures. The write-up explains how these indicators connect staffing outcomes with both cost and culture impacts. It also shows why tracking trend direction matters as much as one-time point values when designing interventions. The key takeaway is that HR teams gain stronger planning leverage when workforce KPIs are visualized and reviewed as an integrated system.
-
Revenue Pipeline Conversion Engagement Dashboard Metrics
This article explains how content marketing dashboards connect publishing activity to business outcomes. It discusses KPI groups for engagement, conversion movement, and revenue contribution across campaigns. The article highlights that selecting the right chart types improves clarity when teams monitor funnel progression. It also notes that standardized reporting helps stakeholders compare performance over time and prioritize higher-impact content work. The overall lesson is that content programs become more accountable when KPI tracking is centralized and tied directly to commercial goals.
-
Marketing Objective Aligned Measurable KPI Selection
This article provides practical guidance on choosing marketing indicators that are useful rather than excessive. It emphasizes starting with business objectives and mapping each KPI to a clear decision or action. The write-up warns that tracking too many disconnected metrics creates noise and slows improvement cycles. It also recommends setting realistic targets and ensuring each KPI can be measured reliably over time. The core conclusion is that disciplined KPI selection produces cleaner insights and stronger execution.
-
List Accuracy Bounce Validity Verification Rates
This piece examines how email verification platforms are evaluated with operational and quality KPIs. It discusses metrics such as percentage verified, validity rates, bounce-related indicators, and processing efficiency. The article explains that reliable verification improves deliverability, protects sender reputation, and supports campaign ROI. It also points out that poor list hygiene can undermine marketing performance even when message strategy is strong. The main takeaway is that verification KPI discipline helps teams sustain cleaner outreach performance at scale.
-
Security Incident Response Coverage KPI Framework
This article focuses on using key indicators to evaluate and strengthen organizational data protection programs. It frames KPI design around clearly defined protection goals and alignment between policies, controls, and outcomes. The write-up explains how consistent monitoring reveals blind spots in incident response, governance, and preventive safeguards. It also emphasizes that KPI review should inform iterative improvement rather than static compliance checklists. The central message is that structured measurement turns data protection from a reactive function into a managed performance discipline.
-
Flight Punctuality Load Factor Utilization Metrics
This article outlines how airline operations teams use KPIs to manage delay risk and network efficiency. It highlights indicators such as punctuality, load factor, aircraft utilization, and revenue passenger kilometers. The article explains that combining these measures with operational analysis improves planning across routes, crews, and assets. It also describes how real-time visibility helps teams respond faster when disruptions threaten service reliability. The practical conclusion is that KPI-led operations management improves both cost control and passenger experience consistency.