Measure Metrics That You Can Do Something About
Below is the continuation of the transcript of a Webinar hosted by InetSoft on the topic of Dashboards for Marketing Departments. The presenter is Mark Flaherty, CMO at InetSoft.
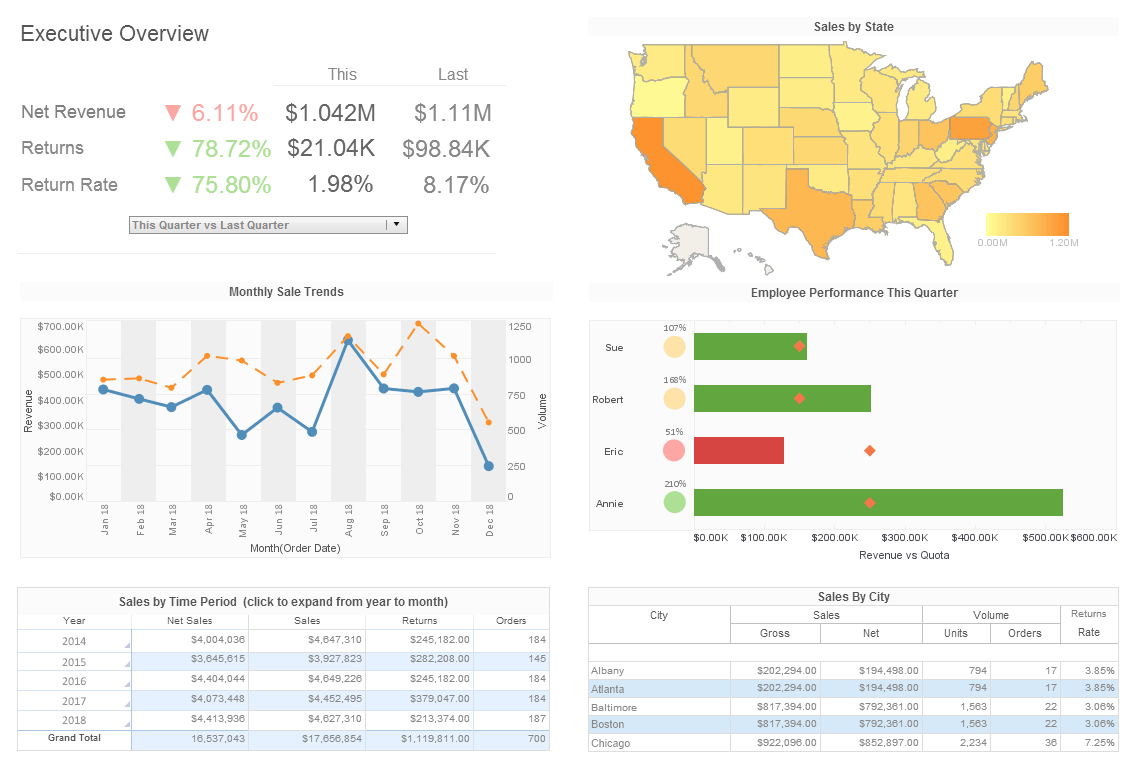
We talked earlier a little bit about how important it is that we measure metrics that you can do something about. This is an example where we are measuring metrics. We're showing things that not only can we as a marketing team learn from, but we can actually help our sales team take action and literally change what's happening within a particular account or a particular prospect or a particular lead.
One thing I do want to focus a little bit on is just get started, experiment, don't stop. Your first dashboards are going to be really simple. I remember, when I was a customer of InetSoft before I joined the company as Jessica mentioned about eight years ago, the way I used InetSoft was the most simple way ever, and I still think of some of this stuff I created were the most beautiful stuff I ever saw, largely because it was information I always wanted to have but I could never get.
So when I could finally get the information and see it, it was the most beautiful thing to me. So don't underestimate the power of just getting started because what's going to happen is you're going to get started, it's going to get easier. It's going to get faster. You're going to start integrating more data sources. You're going to start asking more questions.
| #1 Ranking: Read how InetSoft was rated #1 for user adoption in G2's user survey-based index | Read More |
Experiment with Measurement Metrics
You're going to be able to experiment. You're going to be able to stop and start campaigns, make adjustments on the fly, and do testing. Just get started because you don't need to have everything perfectly in place. You don't need that big business intelligence platform. You don't need to wait for the data to be perfectly clean.
What you need to do is just start, even if the data is a little old, or it's dirty. You'll learn a ton of information from your dirty data frankly when you as a marketer first see the dirty data in your database it will be eye-opening. So, don't wait for everything to be in place because it's probably a long way up, just get started even with simple stuff. You can make great stuff happen.
And by getting started, and getting quick wins, and showing people decisions you can make better because of data that they have, and that they can see literally that you can share with them in a dashboard, you'll get more support for your analytical efforts, you'll get more resources to do the kinds of things that you need to do so keep going.
Let me just show you how easy it is just to get started. I'm actually going to pull up a real basic set of data from an office supplies retailer because I want to give you a quick demo to show you how we do it, how easy it is. So, I'm opening a data source literally in Excel that allows me to simply talk to Excel and show the variables that are in my Excel spreadsheet.
So, I've got all kinds of data here, and I've got all kinds of measures, and it's really as simple as driving sales here and asking the next question which is okay, great, $15 million in sales, how does that look by customer segment. Well, corporate is our biggest segment. Well that's good to know.
 |
View a 2-minute demonstration of InetSoft's easy, agile, and robust BI software. |
What about in terms of product? I'll flip to product. What about product category. Great, furniture is our second best selling. Technology is our top selling. What about product by segment, how does that look? Well, here we go, and we've got technology in corporate being our largest segment, and let's see what it does in terms of profit.
So you can see I am just looking at a spreadsheet, a simple data source, I pointed InetSoft at it very easily. I just told InetSoft to connect the data through this very easy interface, just point it to a file, and now I'm actually at work with my data asking and answering questions as fast as I can discover the answers in the data. So again, I really want to encourage you whether you're using InetSoft, or Excel, or another tool, just get started because you're going to find that the more you use data, the more questions you have, the better you're going to be at it, and the better your decisions are going to be.
So with that I want to encourage you to check out our resources page at InetSoft.com/evaluate. We've put up a lot of white papers, live dashboards, a free online trial, other webinar recordings, all kinds of great information for you there. And I just encourage you to get started as I mentioned we have a free trial that you can use, it's a fully functioning version of InetSoft.
| Previous: Example of a Dashboard Telling a Story |


