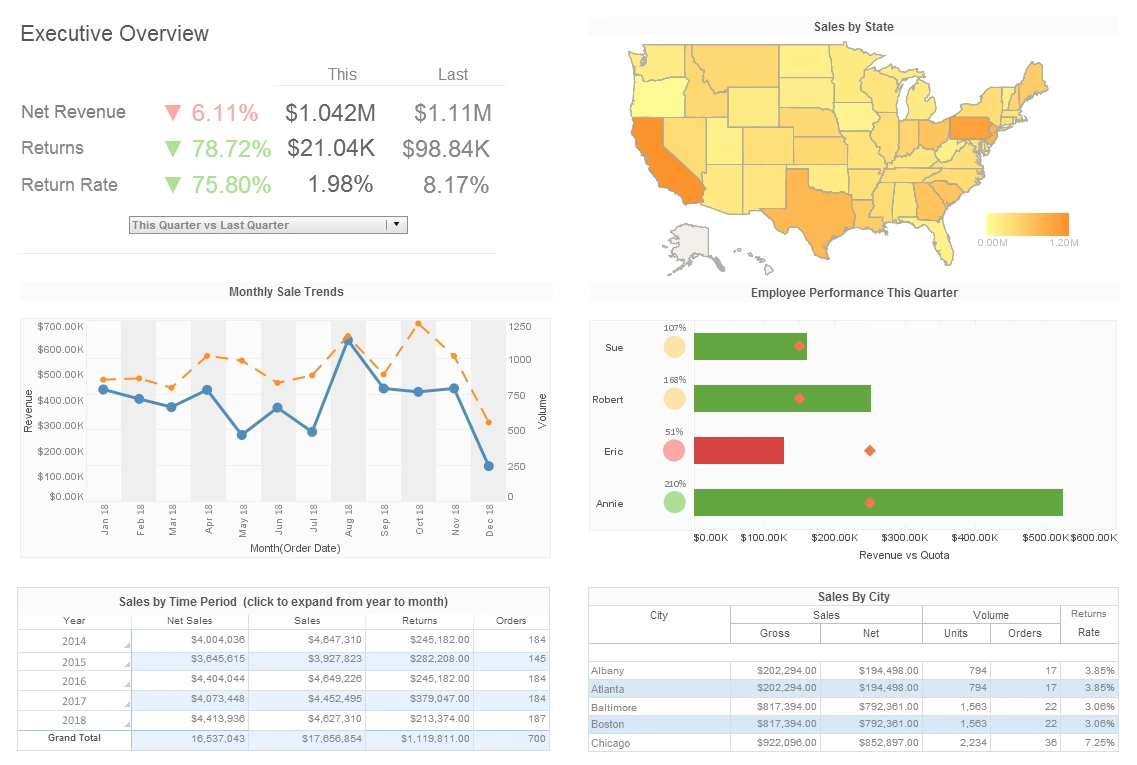
Visual Analytic Reports andPublished Document Reports
Powered by a Data Mashup Engine


Customer Service is the Best I've Encountered!
All the technicians are extremely knowledgeable, patient and will make every effort to accommodate your schedule and resolve the issue in a timely manner. - Jack from BOK Financial
Great Product and Easy to Use
I have been using this product for almost 2 years, and I find it simple to use and gives reliable results. I recently had a team trying to create a report for 2 weeks with another BI product. Since they couldn't build what they needed they came back to me. I was able to get it for them in less than a day with InetSoft. - Steven from Endurance Services
Register for free software and info
Sample Customers


What Data and Metric Do Meteorologists Look at in Reports
Meteorologists analyze a wide array of data and metrics from various sources to produce accurate weather forecasts and reports. These data points and metrics provide insights into atmospheric conditions, climate patterns, and weather phenomena, enabling meteorologists to understand and predict changes in the weather. Here's an in-depth exploration of the data and metrics that meteorologists commonly use in their reports:
-
Satellite Imagery: Satellite imagery provides valuable visual information about cloud cover, precipitation patterns, and atmospheric circulation. Meteorologists analyze satellite images to track the movement of weather systems, identify areas of low and high pressure, and monitor the development of severe weather events such as hurricanes, tornadoes, and thunderstorms.
-
Radar Data: Weather radar systems use radio waves to detect precipitation, measure its intensity, and track its movement in real-time. Meteorologists rely on radar data to monitor the location and intensity of rain, snow, hail, and other forms of precipitation, as well as to identify areas of potential severe weather, such as thunderstorms and tornadoes.
-
Weather Stations: Weather stations located on the ground collect a variety of meteorological data, including temperature, humidity, wind speed and direction, atmospheric pressure, and precipitation. Meteorologists use data from weather stations to monitor current weather conditions, detect trends, and validate forecasts. Automated weather stations and weather balloons are also used to collect data at various altitudes in the atmosphere.
-
Weather Models: Numerical weather prediction models use complex mathematical algorithms to simulate the behavior of the atmosphere and predict future weather conditions. These models ingest vast amounts of observational data, such as satellite imagery, radar data, and weather station measurements, to initialize their forecasts. Meteorologists analyze output from weather models to make short-term and long-term forecasts, assess the likelihood of specific weather events, and identify areas of uncertainty.
-
Temperature: Temperature is a fundamental meteorological parameter that influences weather patterns and climate variability. Meteorologists track temperature data to monitor changes in air temperature over time, identify temperature extremes (e.g., heatwaves, cold snaps), and assess the impact of temperature on human health, agriculture, and ecosystems.
-
Precipitation: Precipitation refers to any form of water, such as rain, snow, sleet, or hail, that falls from the atmosphere to the Earth's surface. Meteorologists measure precipitation using various instruments, including rain gauges, snow gauges, and weather radar. Precipitation data is essential for understanding rainfall patterns, assessing water availability, and predicting the likelihood of flooding or drought.
-
Wind Speed and Direction: Wind speed and direction play a crucial role in shaping weather patterns and atmospheric circulation. Meteorologists measure wind speed and direction using anemometers and wind vanes located at weather stations and other observation sites. Wind data is used to forecast wind-related hazards, such as strong winds, gusts, and windstorms, as well as to assess the potential for air pollution dispersion and energy generation from wind turbines.
-
Humidity: Humidity refers to the amount of water vapor present in the air relative to its maximum capacity at a given temperature. Meteorologists measure humidity using instruments such as hygrometers and psychrometers. Humidity data is important for understanding atmospheric moisture levels, predicting the formation of clouds and fog, and assessing the risk of heat-related illnesses during periods of high humidity.
-
Pressure: Atmospheric pressure, also known as barometric pressure, is the force exerted by the weight of the air above a given point on the Earth's surface. Meteorologists measure atmospheric pressure using barometers. Changes in atmospheric pressure are associated with weather phenomena such as high and low-pressure systems, which influence wind patterns, cloud formation, and weather conditions.
-
Climate Indices: Climate indices are statistical measures that represent long-term climate patterns and variability, such as El Niño-Southern Oscillation (ENSO), North Atlantic Oscillation (NAO), and Arctic Oscillation (AO). Meteorologists analyze climate indices to understand global climate trends, predict seasonal climate patterns (e.g., monsoon seasons, droughts), and assess the potential impacts of climate change on weather extremes and natural disasters.

More Articles About Reports
Big Data in Casino Analytics - Big data in casinos can also monitor player preferences and discover gaming trends. Online casino operators face the challenge of organizing extensive libraries of titles. Big data takes out the guesswork of which to promote. By tracking click rates, payouts, and time spent playing, managers can conclude which games are more popular. They can then use gaming analytics to attract new players and avoid using less popular titles during advertising...
Build Virtual Data Models - Building virtual data models with InetSoft involves creating a representation of data from various sources that can be manipulated and analyzed in a unified manner. While InetSoft is primarily a business intelligence tool, it can be utilized to create virtual data models by leveraging its data integration, transformation, and visualization capabilities...
Five Steps To Creating A Risk Register - Before creating a risk register, you need to set your risk management goals and define your hard and soft KPIs. Doing so will ensure you have all the details required to plan and execute your risk management strategies carefully. That said, here are the five main steps you can follow to create a robust risk register. 1. Risk Identification...
What Does the Concatenation Table Join Do? - In a traditional database context, a "join" operation is used to combine rows from two or more tables based on a related column between them. The most common types of joins are: Inner Join: This returns only the rows that have matching values in both tables...