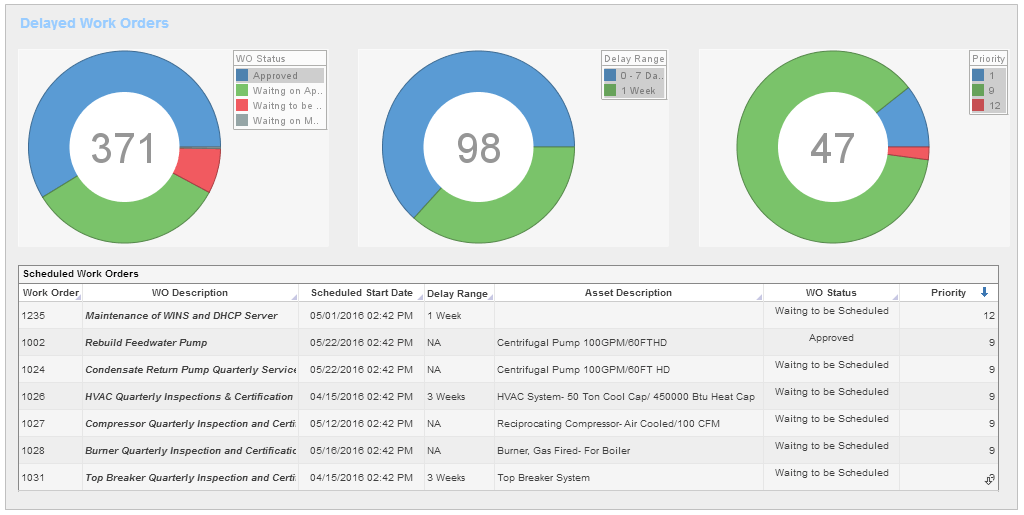
Digital Dashboards for Your Business
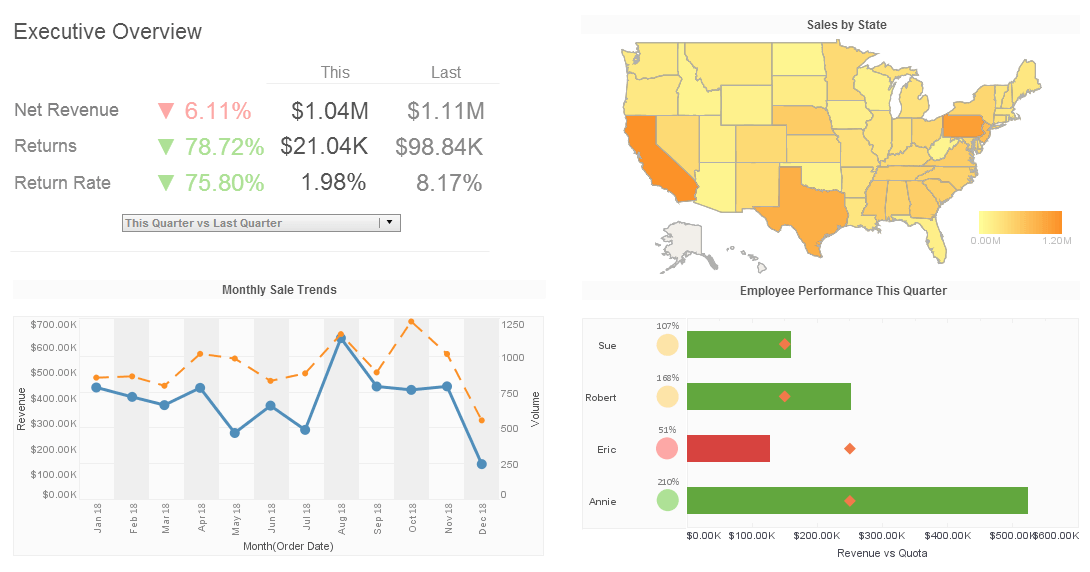
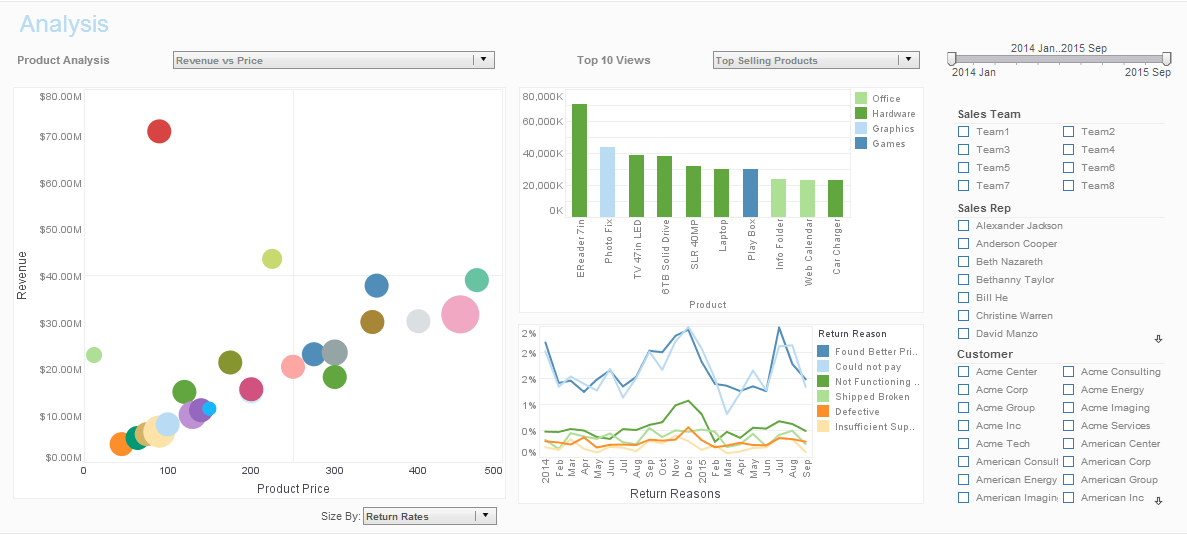
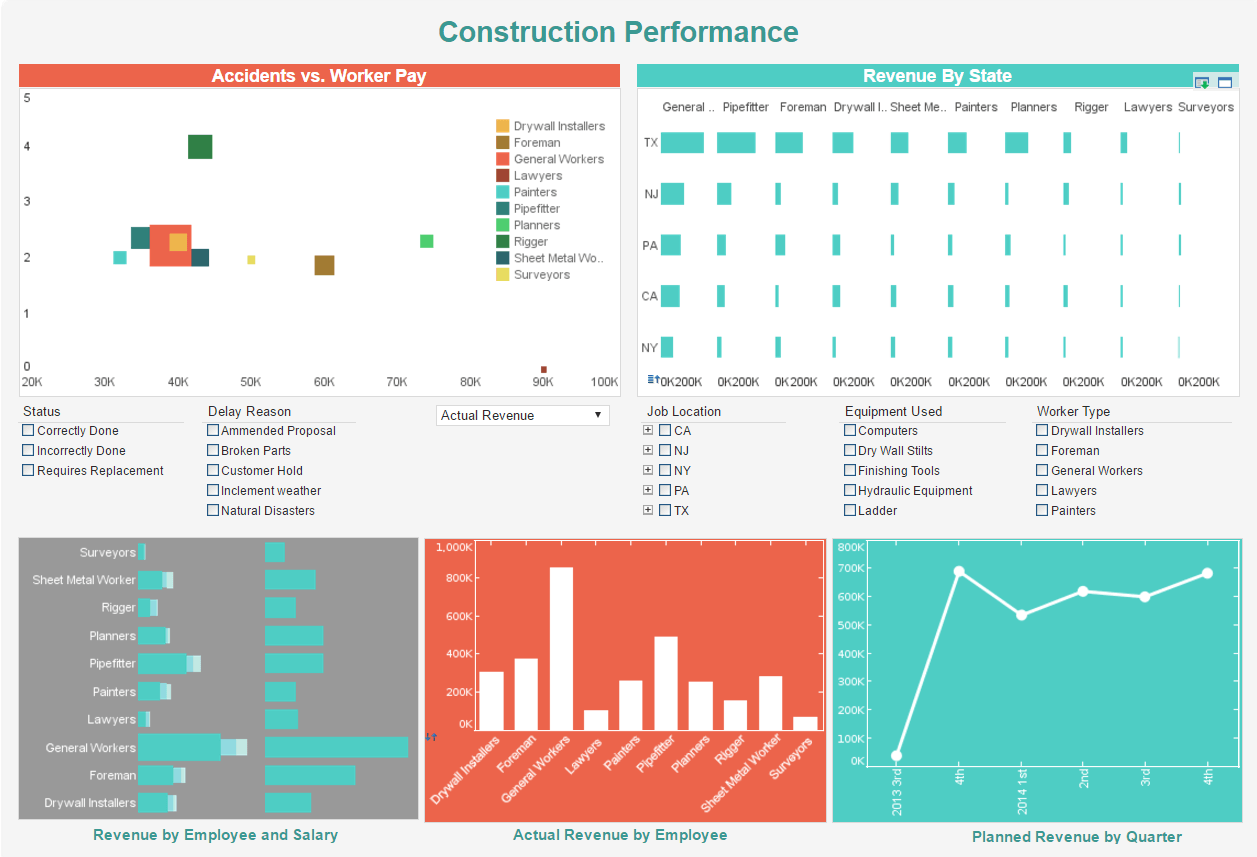
Are you searching for a digital dashboard for your business? InetSoft's StyleBI offers a 100% web-based, server-based solution that delivers exactly what you're looking for.
100% Web-Based BI
Web-based BI offers large advantages over fat-client counterparts
The World Wide Web has become the universal standard for communication today. Every business is online and it follows that your dashboards should be as well. Usability and general familiarity with the platform create a centralized environment for reporting and analysis. This makes web-based BI attractive to many organizations.
Always online tools avoid the need for the costly support staff that is needed to troubleshoot desktop-bound software for hundreds (or thousands) of users. When everyone is using the same tools, it becomes much easier to offer support when users have questions or concerns.
Web-based tools have the unique ability to share information with an infinite number of end users, at home or abroad, with minimal effort. This information is typically in the form of dashboards, reports, and scorecards that enable users to estimate future outcomes or any number of other business processes.
Advantages Over Desktop Applications | Server-Based Visualization
Faster deployment, automatic security, and more...
StyleBI is a Web-based server-side tool. It is made up of a collection of reusable server components which can be integrated into other applications and servers, or used "as is" to provide a complete BI solution.
Being server-based, StyleBI allows users to connect remotely to data sources, making it accessible to a broader user base.
Additionally, the application is equipped with automatic data security measures that will only show appropriate data based on the user's IT-defined permissions. By contrast, desktop applications typically provide a single-view of the data to be published.
Desktop tools are developed using a single dataset that uses scripting to pull multiple sources together. InetSoft is unique in this regard, allowing end-user data mashup though an intuitive drag-and-drop method of manipulating and combining data from disparate data sources.
Finally, server-based digital dashboard tools are targeted at a much broader range of users. Because the infrastructure only needs to be set up once, users can create mashups and dashboards through the aforementioned drag-and-drop. Desktop tools, on the other hand, are targeted at trained analysts that have the necessary scripting ability to build a dashboard from scratch.
Simply put, server-based tools like StyleBI empower end users and encourage self service.
| #1 Ranking: Read how InetSoft was rated #1 for user adoption in G2's user survey-based index | Read More |
About InetSoft
InetSoft is a pioneer in delivering easy, agile, and robust business intelligence software that makes it possible for organizations and solution providers of all sizes to deploy or embed full-featured business intelligence solutions. Application highlights include visually-compelling and interactive dashboards that ensure greater end user adoption plus pixel-perfect report generation, scheduling, and bursting.
InetSoft's patent pending Data Block™ technology enables productive reuse of queries and a unique capability for end-user defined data mashup. This capability combined with efficient information access enabled by InetSoft's visual analysis technologies allows maximum self-service that benefits the average business user, the IT administrator, and the developer. InetSoft solutions have been deployed at over 5,000 organizations worldwide, including 25% of Fortune 500 companies, spanning all types of industries.
How Are Digital Dashboards Used by Financial Advisory Consultants
Digital dashboards have become indispensable tools for financial advisory consultants in today's fast-paced, data-driven business environment. They serve as dynamic interfaces that consolidate and visualize crucial information from various sources, allowing consultants to make informed decisions and offer valuable insights to their clients. Here's a comprehensive look at how financial advisory consultants use digital dashboards:
-
Real-Time Data Monitoring
- Financial markets are highly volatile and can change rapidly. Digital dashboards allow consultants to monitor real-time market data, including stock prices, indices, exchange rates, and commodity prices. This enables them to respond promptly to market developments and adjust investment strategies accordingly.
-
Portfolio Management
- Consultants use digital dashboards to track the performance of their clients' investment portfolios. They can aggregate data from different accounts and asset classes, providing a holistic view of the portfolio's health. This allows for timely rebalancing, risk assessment, and performance evaluation.
-
Risk Assessment and Management
- Dashboards help consultants assess the risk profiles of their clients' investments. They can integrate risk metrics, such as standard deviation, beta, and Value at Risk (VaR), to quantify and visualize potential losses. This information guides the selection of appropriate investment products and strategies that align with the client's risk tolerance.
-
Financial Planning and Forecasting
- Consultants use digital dashboards to create comprehensive financial plans for their clients. They can project future cash flows, expenses, and investment returns based on different scenarios. This allows clients to make informed decisions about savings, retirement, and major financial milestones.
-
Client Reporting and Communication
- Dashboards serve as powerful communication tools. Consultants can generate customized reports summarizing portfolio performance, investment allocations, and financial goals. These reports are often interactive, allowing clients to explore their financial data in a user-friendly manner.
-
Compliance and Regulatory Reporting
- Staying compliant with industry regulations is crucial for financial advisory consultants. Digital dashboards can automate the process of generating compliance reports, ensuring that all necessary information is accurately recorded and accessible when needed.
-
Data Integration and Aggregation
- Consultants often work with data from various sources, including financial institutions, market data providers, and accounting software. Dashboards can integrate these disparate data sets, providing a unified view that enhances decision-making capabilities.
-
Client Education and Empowerment
- Digital dashboards can be used as educational tools to help clients understand their financial situation. Consultants can create visualizations and charts that simplify complex financial concepts, enabling clients to become more informed and engaged in their own financial planning.
-
Performance Benchmarking
- Consultants use dashboards to compare the performance of their clients' investments against relevant benchmarks, such as market indices or peer group averages. This helps in evaluating the effectiveness of the investment strategy and identifying areas for improvement.
-
Trend Analysis and Insights
- By leveraging historical data, dashboards enable consultants to identify trends and patterns in the financial markets. This analysis can inform investment decisions and provide valuable insights into potential opportunities and risks.
 |
View live interactive examples in InetSoft's dashboard and visualization gallery. |
More Articles About Digital Dashboards in Business
Capabilities of an Airline Dashboard - Self-service travel management Every dashboard consists of tabs or as they are also called workspaces or views. The number of these pages can vary from one airline to another, depending on its size and goals. Below we will tell you what elements these tabs include and how airlines use the obtained data. 1. World map and main key performance indicators Remember when companies needed paper help because there were ceiling-high piles of documents on the desks...
Evolution of Customized Marketing - The first technology is content customization, the ability to adapt content and advertising to the individual customer. This is easiest to appreciate in the context of digital delivery of videos and other media, where content and ads are tailored to the individual viewer. But the development of content customization has penetrated less conspicuous areas also, such as the coupons...
 |
Read how InetSoft saves money and resources with deployment flexibility. |
Necessity of Real-Time Reporting - Prior to the digital technological era we live in today, companies had ample amount of time to assemble, process, and package business data for executives. Businesses and their competitors moved at a slow steady pace, leaving sufficient time to calculate numbers and analyze reports...
Personalized Demo of Web-based Dashboards - Are you looking for a web-based dashboard application? Tell us your main goals in deploying dashboards and major obstacles with your current solution, and we will customize a demo for you. We will show you how to build self-service oriented dashboards quickly. And if you are happy with what you see, we will provide free technical assistance in setting up your evaluation...
Resources About Data Discovery Software Vendors - Are you looking for data discovery software vendors? Since 1996 InetSoft has been a BI application innovator and its Web-based visualization solution is quickly deployed and easily used. View a demo. Review the resources and articles below for more information. They were also suggesting other products that they may buy. I mean this is sentiment analysis. There was a lot of negative sentiment against this one store or one chain, and it came back...
Setting the Colors on a Dashboard Output Gauge - The "Dashboard Output Gauge" is a specific component or widget within InetSoft's dashboarding platform. A gauge, in this context, is a graphical representation of a single value or a set of values. It's designed to provide a visual indication of the status, progress, or performance of a particular metric or KPI (Key Performance Indicator)...
 |
Learn about the top 10 features of embedded business intelligence. |
What Are Some DevOps Key Performance Metrics? - Some of the key performance metrics used in DevOps include Lead time: The time taken from code commit to production deployment. Mean Time to Recovery (MTTR): The average time it takes to resolve production failures. Change failure rate: The percentage of changes that result in failures in production. Deployment frequency: The number of times changes are deployed to production in a given period. Error rate: The number of errors per unit of time or per number of transactions...
