Try Mobile Business Intelligence Reporting Solution
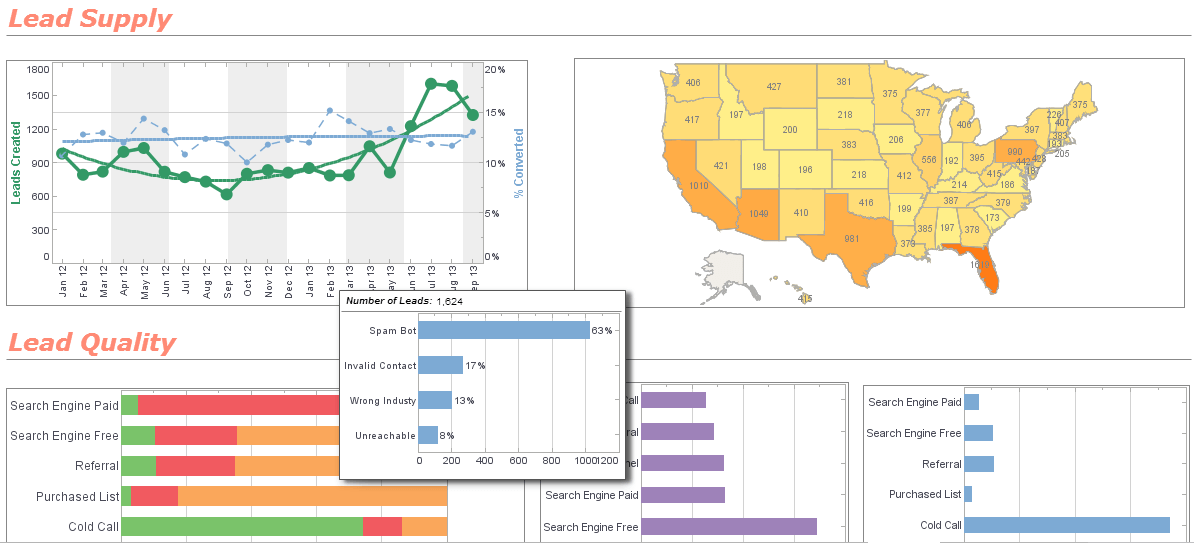
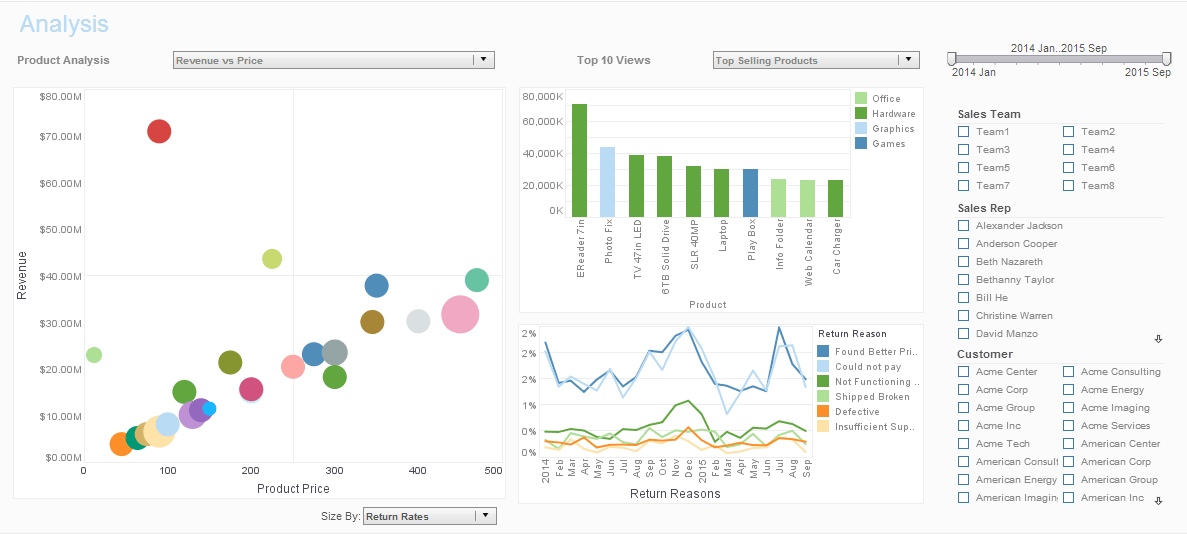
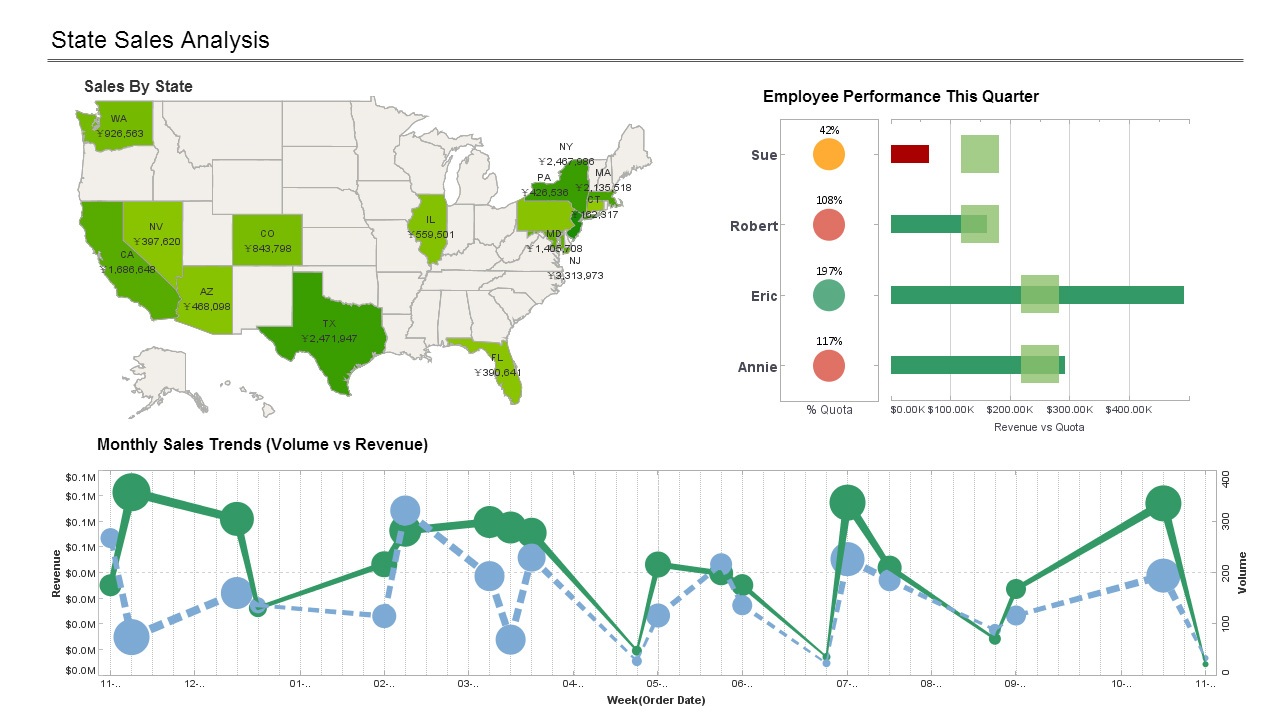
Are you looking for mobile business intelligence reporting solutions? Since 1996 InetSoft has been making BI software that is easy to deploy and easy to use. Get interactive dashboards on phones and tablets quickly. The solution offers both native apps and HTML5 delivery via a browser. View a demo and read customer reviews from some of the 5,000+ happy customers.
 |
View a 2-minute demonstration of InetSoft's easy, agile, and robust BI software. |
Why InetSoft?
InetSoft's mobile BI reporting application is easy enough to be:
- Deployed in just weeks
- Learned by end users with minimal training
- Used by any executive without the aid of IT
agile enough to be:
- Adaptable to changing data and business needs
- Used for data exploration through visualization
- Capable of maximum self-service
and robust enough to:
- Attract the attention of executives
- Meet the demands of power users
- Scale up for organizations of any size
Evaluate StyleBI from InetSoft. It's Easy. Agile. & Robust.
Register for more info and to download free eval software
About InetSoft
Since 1996 InetSoft has been delivering easy, agile, and robust business intelligence software that makes it possible for organizations and solution providers of all sizes to deploy or embed full-featured business intelligence solutions. Application highlights include visually-compelling and interactive dashboards that ensure greater end-user adoption plus pixel-perfect report generation, scheduling, and bursting. InetSoft's patent pending Data Block™ technology enables productive reuse of queries and a unique capability for end-user defined data mashup.
This capability combined with efficient information access enabled by InetSoft's visual analysis technologies allows maximum self-service that benefits the average business user, the IT administrator, and the developer. InetSoft was rated #1 in Butler Analytics Business Analytics Yearbook, and InetSoft's BI solutions have been deployed at over 5,000 organizations worldwide, including 25% of Fortune 500 companies, spanning all types of industries.
 |
Read why choosing InetSoft's cloud-flexible BI provides advantages over other BI options. |

What KPIs and Metrics Are Tracked in Mobile Dashboards for Cellular Network Field Technicians?
-
Response Time: Time taken to respond to a task or assignment.
-
Significance: Measures promptness and ability to meet deadlines.
-
Task Completion Rate: Percentage of tasks completed within a given timeframe.
-
Significance: Evaluates productivity and ability to meet targets.
-
First-Time Fix Rate (FTFR): Percentage of tasks resolved on the first visit.
-
Significance: Measures efficiency and quality of work.
-
Mean Time to Repair (MTTR): Average time taken to repair or resolve an issue.
-
Significance: Assesses efficiency and speed of resolution.
-
Network Quality Metrics: Signal strength, dropped calls, data speeds, etc.
-
Significance: Monitors network performance and technician's impact on it.
-
Job Closure Rate: Percentage of tasks closed within a given timeframe.
-
Significance: Evaluates ability to complete tasks and close jobs efficiently.
-
Travel Time: Time spent traveling between sites.
-
Significance: Optimizes routes and reduces unnecessary travel.
-
Utilization Rate: Percentage of available time spent on tasks.
-
Significance: Measures productivity and efficient use of time.
-
Customer Satisfaction (CSAT): Feedback and ratings from customers.
-
Significance: Assesses technician's communication skills and quality of service.
-
Safety Metrics: Incidents, near-misses, or safety protocol compliance.
-
Significance: Prioritizes technician safety and well-being.
-
Monitor performance and productivity
-
Identify areas for improvement and training
-
Optimize resource allocation and scheduling
-
Enhance customer satisfaction and network quality
-
Prioritize safety and efficiency
 |
Learn the advantages of InetSoft's small footprint BI platform. |
How Is Artificial Intelligence Used in Cellular Network Operations?
-
Network Optimization: AI algorithms can dynamically adjust network parameters in real-time, improving performance and efficiency.
-
Enhanced Performance: AI predicts surges in demand and adjusts network resources accordingly.
-
Improved Security: AI can detect unusual patterns in network traffic in real-time, indicating a security threat.
-
Network Slicing: AI can create multiple virtual networks with different characteristics over a single physical infrastructure.
-
Enhanced User Experiences: AI can analyze network conditions and user behavior to dynamically adjust Quality of Service (QoS) settings.
-
Embrace AI-driven tools for service operations: AI-driven tools assist network engineers automate and streamline network activities and incident management.
-
Place AI at the heart of CAPEX agenda: AI technology can deliver critical data with capabilities of deep learning and dynamic modeling in capex planning tools.
-
Analyzing logs of data with AI: AI automates the analysis of data generated in huge amounts from internal procedures, server logs, applications, network controllers, and other equipment.
-
Automatically prioritizing critical network traffic: AI-enabled smart switching ensures timely delivery of critical traffic.
-
AI increases flexibility of cloud-enabled networks: AI is gaining traction in the network management field and assisting operators to manage 5G networks.
Read what InetSoft customers and partners have said about their selection of Style Report as their production reporting tool. |
More Articles About Mobile BI
Best Practices for a Strong KPI Dashboard - The first step is to understand why dashboard reporting is useful. Choosing the appropriate KPIs to make your dashboard effective is the next step. Although this may differ depending on the department and the general objectives of your business or customer, there are certain universal trends...
Change the Way BI Users Consume - This behavior will evolve in the organization as users become accustomed to the data they have and how they use it. Answering one question with interactive data often leads to users thinking of another question they want to ask. With the right self-service tools, they just navigate to that information. This is the complete opposite of the traditional BI landscape, where people provided management with printed reports or even the static online reports...
How to Do Smart Data Analysis - To cut through information overload of running a business, part of your BI strategy must be smart data analysis. Smart data is often described as data with hidden qualities, such as veracity and value. Finding data with these qualities will help a decision maker hone in on and exploit metrics to their fullest potential. The main difference between smart data and normal boring data is that smart data is the best path toward action...
ROI from Smart Grids - the smart grid, it's really a way for utilities to operate their electric system in a smarter way. They do that based on additional intelligence and information and it comes from a couple of different sources. It comes from the operation, their grid where they have more sensors on their transmission and their distribution system...


