Report Wizard Layout Types
StyleBI, InetSoft's flagship BI product, is a complete business intelligence suite, with a heavy focus on end-user self-service and ad hoc reporting.
To empower end-users, StyleBI is designed to be easy to use with or without IT training. Out of the box, you can use the built in reporting wizard to create crosstab, table, section, and chart-based reports.
Select a Report Wizard | Crosstab Wizard
When you create a crosstab report. Data is displayed in a pivot table, where it is grouped by row and column headers. Summary data is displayed at the intersections.
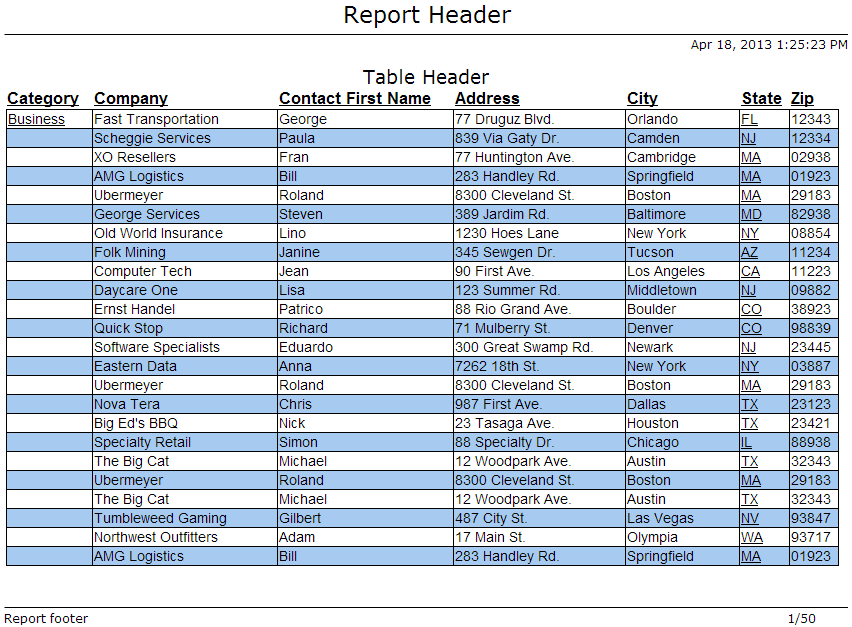
Select a Report Wizard | Table Wizard
When you create a table-based report, data can be displayed in plain tabular layout, or grouped and summarized.
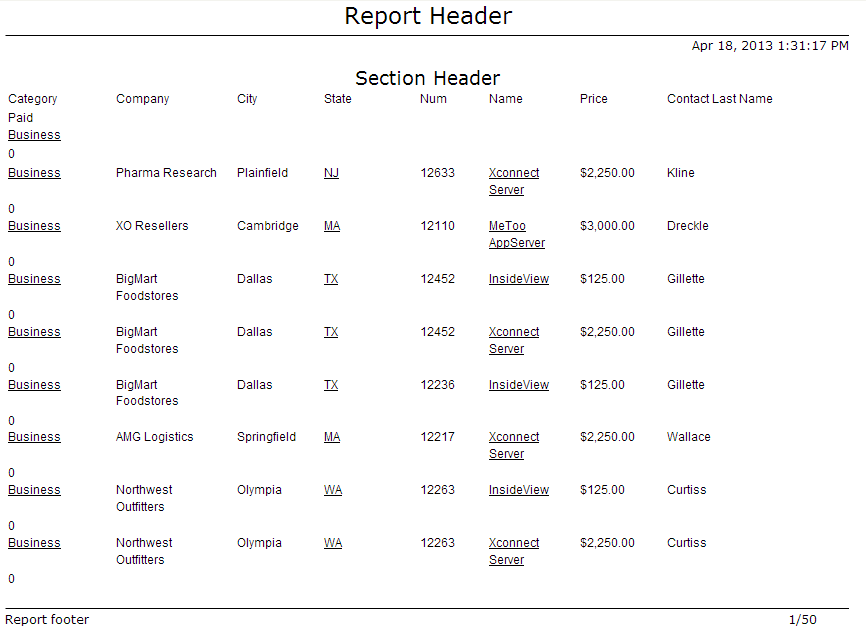
Select a Report Wizard | Section Wizard
When you create a section-based report, sections are similar to tables, but provide layout control over individual fields.
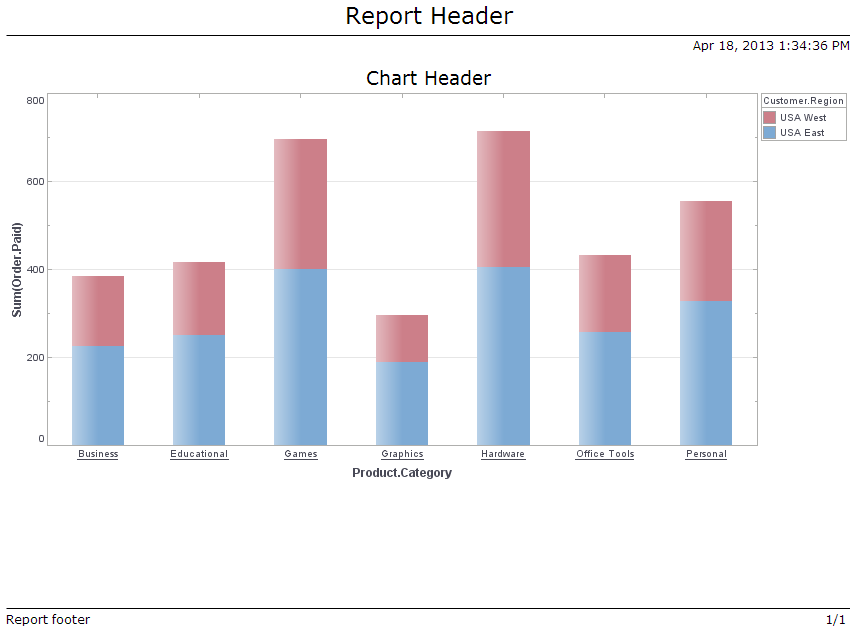
Select a Report Wizard | Chart Wizard
When you create a chart-based report, charts visually display grouped and summarized data.

What Are the Various Report Layout Types and What Are the Advantages of Each?
Reports are essential tools for communicating information, insights, and data in a structured manner. The layout of a report significantly impacts how effectively this information is conveyed and understood by the audience. Various report layout types cater to different purposes and audiences, each with its own set of advantages. Below, we explore the most common report layout types and discuss their benefits.
1. Formal Report Layout
Definition
Formal reports are structured documents typically used in professional and academic settings. They follow a standardized format that includes a title page, table of contents, executive summary, introduction, body, conclusion, and appendices.
Advantages
- Comprehensive Information: The structured format ensures that all relevant information is included and presented logically.
- Professionalism: The formal layout is widely recognized and respected in professional and academic circles, lending credibility to the report.
- Clarity and Organization: The standardized sections help readers easily navigate through the report and find specific information.
2. Informal Report Layout
Definition
Informal reports are less structured than formal reports and are often used for internal communication within organizations. They may take the form of memos, emails, or short summaries and typically lack the formal sections of a formal report.
Advantages
- Speed and Efficiency: The less rigid structure allows for quicker preparation and dissemination of information.
- Flexibility: The format can be easily adapted to suit the specific needs of the audience and the nature of the information being conveyed.
- Accessibility: Informal reports are often easier to read and understand, making them suitable for a wider audience.
3. Analytical Report Layout
Definition
Analytical reports provide an in-depth analysis of a particular issue, problem, or set of data. They typically include sections such as an introduction, methodology, analysis, findings, and recommendations.
Advantages
- Detailed Analysis: The layout allows for thorough examination and interpretation of data, leading to well-supported conclusions and recommendations.
- Problem-Solving: By focusing on analysis, these reports help identify issues and propose actionable solutions.
- Data-Driven Insights: The inclusion of methodologies and analysis ensures that the findings are based on solid evidence.
4. Informational Report Layout
Definition
Informational reports focus on providing factual information without analysis or recommendations. They are used to present data, updates, and summaries on specific topics.
Advantages
- Conciseness: These reports deliver essential information in a straightforward manner, making them quick to read and easy to understand.
- Objectivity: By presenting facts without analysis, informational reports maintain neutrality and allow readers to form their own conclusions.
- Regular Updates: Their straightforward nature makes them ideal for regular reporting, such as weekly updates or status reports.
5. Proposal Report Layout
Definition
Proposal reports are used to suggest a course of action, project, or solution to a problem. They typically include an introduction, problem statement, proposed solution, benefits, implementation plan, and a conclusion.
Advantages
- Persuasive Structure: The layout is designed to persuade the reader of the viability and benefits of the proposed solution.
- Clear Presentation: By clearly outlining the problem and proposed solution, these reports make it easy for decision-makers to understand and evaluate the proposal.
- Action-Oriented: The focus on implementation plans ensures that the report is not just theoretical but provides practical steps for action.
6. Progress Report Layout
Definition
Progress reports provide updates on the status of ongoing projects or initiatives. They typically include sections such as an introduction, summary of progress, challenges encountered, and next steps.
Advantages
- Transparency: Regular updates on progress foster transparency and keep stakeholders informed.
- Accountability: By documenting progress and challenges, these reports promote accountability among team members.
- Early Problem Detection: Regular reporting helps identify and address issues before they become significant problems.
7. Technical Report Layout
Definition
Technical reports document technical information, research, or findings. They often include sections such as an abstract, introduction, methodology, results, discussion, and conclusion.
Advantages
- Detailed Documentation: The layout ensures comprehensive documentation of technical work, making it a valuable reference.
- Scientific Rigor: The structured format supports the presentation of technical and scientific research in a clear and systematic manner.
- Knowledge Sharing: These reports facilitate the sharing of technical knowledge and findings within and outside the organization.
8. Financial Report Layout
Definition
Financial reports present financial data and analysis, such as income statements, balance sheets, cash flow statements, and financial ratios. They are typically used in business and finance.
Advantages
- Financial Transparency: These reports provide a clear picture of the financial health of an organization.
- Decision-Making: By presenting detailed financial information, these reports support informed decision-making by stakeholders.
- Regulatory Compliance: The standardized format helps organizations comply with financial reporting regulations and standards.
9. Case Study Report Layout
Definition
Case study reports present detailed analysis of a particular case, event, or situation. They typically include an introduction, background information, analysis, and conclusions.
Advantages
- In-Depth Analysis: The layout allows for thorough exploration of specific cases, providing valuable insights.
- Learning Tool: Case studies are often used as educational tools, helping readers understand complex issues through real-world examples.
- Practical Applications: By examining specific cases, these reports can offer practical lessons and strategies for similar situations.
10. Marketing Report Layout
Definition
Marketing reports analyze marketing activities, strategies, and performance. They typically include sections such as an executive summary, market analysis, campaign performance, and recommendations.
Advantages
- Performance Tracking: These reports help track the effectiveness of marketing campaigns and strategies.
- Strategic Insights: By analyzing market trends and campaign results, these reports provide insights for future marketing efforts.
- Alignment with Goals: The structured format helps ensure that marketing activities align with business objectives and targets.
11. Annual Report Layout
Definition
Annual reports provide a comprehensive overview of an organization's activities and financial performance over the past year. They typically include sections such as a message from the CEO, financial statements, operational highlights, and future outlook.
Advantages
- Comprehensive Overview: Annual reports provide a detailed summary of an organization's performance and achievements.
- Stakeholder Communication: These reports are an important tool for communicating with stakeholders, including investors, employees, and customers.
- Strategic Reflection: The process of creating an annual report allows organizations to reflect on their successes and challenges, informing future strategies
 |
View the gallery of examples of dashboards and visualizations. |
More Articles About Reporting
InetSoft's Data Visualization Chart Types - The following is a listing of the various chart types enabled by InetSoft's StyleBI data visualization software. A Gantt chart is a visual representation of a project schedule, showing the start and end dates, duration, and dependencies of each task. It is commonly used in project management to track progress and help coordinate the efforts of team members. The chart is named after Henry Gantt, who developed the concept in the 1910s...
Interactive Forms in a Report - Report Designer supports data entry and report customization through interactive forms. A form is a collection of interactive controls, such as Text fields, Radio Buttons, and Combo Boxes. Interactive forms are used primarily in two roles: Embedded in reports to allow report customization, and embedded in parameter sheets to allow parameter entry...
Select a Report Wizard - When you create a crosstab report. Data is displayed in a pivot table, where it is grouped by row and column headers. Summary data is displayed at the intersections. Select a Report Wizard | Table Wizard When you create a table-based report, data can be displayed in plain tabular layout, or grouped and summarized...
Summarization of Tabular Data - This section discussed grouping and summarization of tabular data. Many business reports require some processing on the raw data before presenting them as tables. The most common processing is the grouping and summarization of table rows. This is usually a post data retrieval operation and takes place after the data is loaded into a lens object and bound to an element...


