InetSoft Presentation: BI Platform for Big Data
This is the continuation of the transcript of an InetSoft presentation and demo for a business intelligence analyst in March 2018. The highlights are in the area of collaborative BI.
Presenter: Let’s move ahead. This is definitely a BI platform that’s built to scale for big data and large volumes of users. It's built on the concept of using this commodity servers and scaling up with clusters and nodes. That’s in contrast to other BI solutions that require heavy duty data appliances and or even huge memory capable servers. So that’s the quick overview of the BI application.
Here I just wanted to highlight some of the features that are collaboration specific, and we’re going to show them as well. But being a server based solution from the beginning, that contrast with some of the desktop applications like Tableau. When everything is saved on the server, it’s just inherently sharable.
Here’s a list of other historical collaboration features, the things that people reuse. These are bunch of InetSoft terms here, but you’ll see them an action in the demo. Data blocks are queries that you create in a drag-and-drop environment.
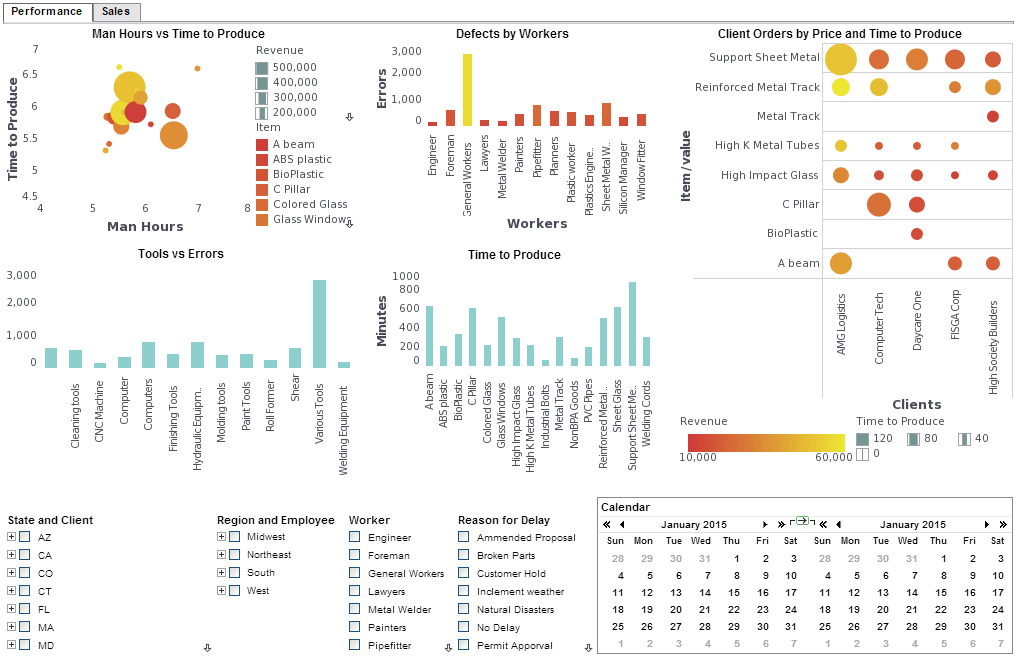
They pull together different bits of data that you want to use and a dashboard or report. Worksheets are the canvas to combine those different data blocks into full data set using data mash up. With the data mashup, you can use it to create dashboards and reports in a viewsheet. It is our terminology for a dashboard of visualization that you create in the drag-and-drop design environment.
| #1 Ranking: Read how InetSoft was rated #1 for user adoption in G2's user survey-based index | Read More |
Attendee: So I mean, is that data block, is that like an OLAP cube or something?
Presenter: It's the selection of fields, and those fields can come from many different kind of data sources including everything from relational databases to spreadsheets.
Attendee: And does the data get pulled out into in memory engine, or does it actually query the source.
Presenter: By default it’s the latter. Attendee: Okay. Presenter: Yeah, we also have an intermediate caching data layer that you can turn on for performance seasons.
Attendee: Okay. Yeah, yeah.
Presenter: You’ll see what it’s like. We have given organization structure to dashboards and reports. You can put them in different folders and have different roles. Departments can access whichever folders you want to give them permissions to. Some of the new features that are collaborative specific, that’s really what the theme of this release was, first is annotations which are pretty simply described as notes added to a dashboard or visualization.
Then comes shared bookmarks. This may be new to you. It means basically saving the settings of an interactive dashboard or visualization. That could be the filter list selections that you may have made. Even the charting options could be saved. In the past you could bookmark those and save those for you own use and come back to them and scroll through them. So you can go back to of a view that you find useful.
The new feature is being able to share those across an organization with whatever granularity of a permission sharing you want. And then the third here means searching across previously built viewsheets and worksheets so you can in leverage whatever people have created in the past and avoid necessarily duplicating their efforts. So then we’ll talk about how this contrasts with other ways people might describe those capabilities with those examples where collaboration can be defined differently.
Attendee: Okay.
 |
View live interactive examples in InetSoft's dashboard and visualization gallery. |
Presenter: So StyleBI is our primary product, and it's a comprehensive BI platform with this strong and flexible data access layer that we started to talk about. And you have got the two main presentation capabilities that people look for. Visualization is the application that people use for creating dashboards and visual analyses, and then publishing is creating the paginated reporting whether it's for PDF distribution or interactive web consumption.
Attendee: Okay.
Presenter: And since we start to talked about this already I’ll skip this slide. I’ll give you these slides for your reference, but I guess seeing them would make like more sense. Here are a couple of screenshots of what you’ll see samples of coming ahead with the reporting designer.
Attendee: Can I ask for technology for the web, it it Flash or HTML5. Is everything is web based?
Presenter: Yeah, so on a client side it’ll render in Flash or HTML5 depending on what’s present. So that is an addition from last year. That’s broadened our mobile BI capability. We don’t create native mobile apps. We rely on a browser, and then whatever it has, we’ll support.
 |
Read why choosing InetSoft's cloud-flexible BI provides advantages over other BI options. |
Attendee: Yeah, I think that was pretty smart, I think that’s where we’re going. There are couple of companies that make native apps. I think eventually we will see more and more browser based kind of things.
Presenter: Yeah, I mean the overhead for supporting client apps is expensive. It’s funny that there’s any movement back to client apps. I thought that a lot of companies and developers and vendors learned that over a decade ago.
Attendee: You get more native features, but I think on the long run it just going to bite them.
| Previous: Collaborative BI Demo |


