Looking for Consolidated Dashboard Software?
Between BI vendors, CRM solutions, marketing programs, and other types of informational solutions, companies often find themselves with numerous dashboards and reporting options from different providers, all designed for different purposes and data sources. Analysts are left to sort through multiple solutions to find observations that will hopefully add up to meaningful insights.
As such, businesses are in need of a platform that can pull data from any kind of source into consolidated dashboards, to make data analysis convenient and efficient, and to remove the need to go through various dashboards or reports to answer a single question.
InetSoft's StyleBI is the only business intelligence software organizations will need for all their dashboarding, reporting, and data management needs.
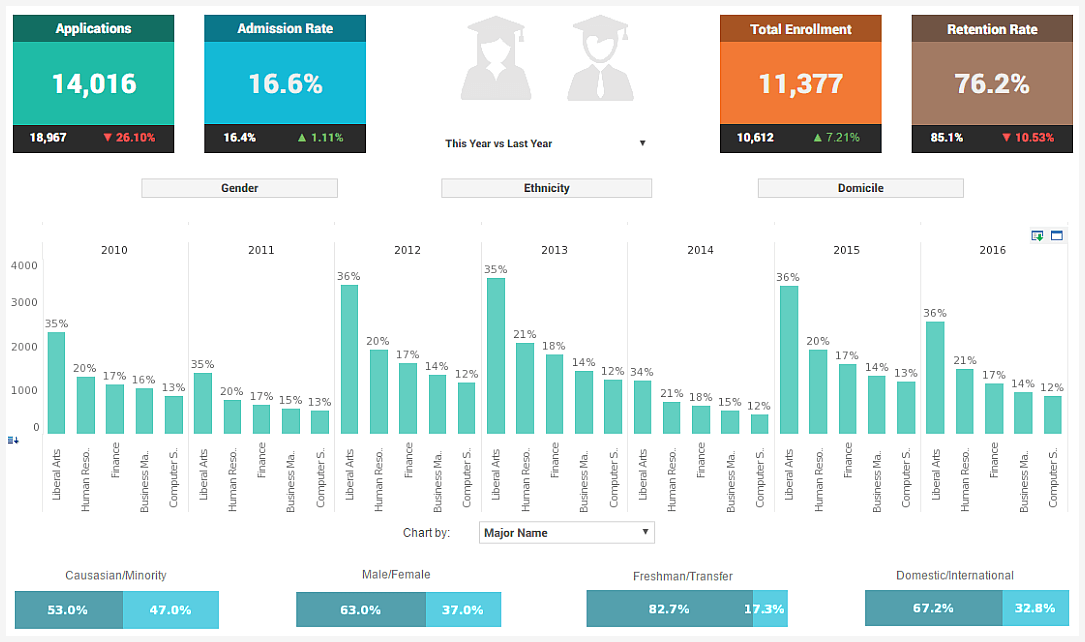
StyleBI's Java-based application is a robust and intuitive business intelligence solution that provides users the ability to consolidate any kind of data into one single interactive dashboard, for efficient and effective visualization.

StyleBI’s Interactive Features
StyleBI's main tool for consolidating data is it's proprietary data worksheet, where users can combine data from various source types, joining similar fields and reformatting live data into a single consolidated dashboard or report. Data mashup gives businesses the ability to gather a multitude of data from various vendors. As an example, a firm could consolidate various metrics from different financial applications into one financial statement, for a single visualization that enables faster decision-making on budgets and profits.
In addition, companies seeking a consolidated dashboard software most likely have a copious amount of data that needs to be processed. Thus, for developers, StyleBI's optional data grid cache allows maximum flexibility, as a data accelerator that speeds up data processing for unlimited scalability. This lets users work with data pulled from any hard drives, caches or RAM in distributed servers in a cluster on any device, regardless of how much RAM or memory is available. The data grid cache is the perfect option for administrators of a business looking for a program that supports large amounts of data and massive concurrency, with information that is up to date.
To complement a wide range of charts and graphs available for dashboards, StyleBI users are also given various drill-down options, as tools to enhance visual analysis. End-users can simply select a certain range of data on one dashboard and see all other charts and displays shift to show characteristics regarding the specified data range. A great example of using drilldown for more in-depth analysis would be on an interactive sales dashboard, where end-users could specifically view their sales by factors such as state, year, or product, and immediately access any data in spreadsheet form that met those parameters. StyleBI's interactive features make InetSoft the only dashboard software provider required, for any and all visualization and reporting needs.
What Are the Features to Look for in Consolidated Dashboard Software?
When evaluating consolidated dashboard software, it’s essential to look for features that enable comprehensive data integration, intuitive visualization, and real-time decision support. A top priority is robust data connectivity, allowing the platform to pull from diverse sources—databases, APIs, cloud services, spreadsheets—and combine them into a unified view without requiring heavy ETL programming. Equally important is the ability to perform data transformations and mashups on the fly, enabling users to shape and cleanse data within the dashboard environment.
Customizable and interactive visualizations are critical for tailoring dashboards to specific audiences and use cases. Users should be able to filter, drill down, and explore data dynamically, with support for a variety of chart types, KPIs, maps, and tabular formats. In addition, a consolidated dashboard solution should offer role-based access control, so different users only see data relevant to them, ensuring security and compliance in multi-departmental or multi-client scenarios.
Another vital feature is real-time or near-real-time data refresh, which ensures that decision-makers are acting on the most current information. Built-in alerting and notification capabilities further enhance this by proactively flagging metric thresholds or anomalies. Finally, consolidated dashboard software should support collaboration tools, including annotations, sharing options, export formats, and integration with communication platforms, to promote a shared understanding of key metrics across the organization.
About InetSoft
Since 1996 InetSoft has been delivering easy, agile, and robust business intelligence software that makes it possible for organizations and solution providers of all sizes to deploy or embed full-featured business intelligence solutions. Application highlights include visually-compelling and interactive dashboards that ensure greater end-user adoption plus pixel-perfect report generation, scheduling, and bursting.
InetSoft’s mission is simple:


