InetSoft Webinar Highlights: Contour Chart Software and More
This is the transcript of a Webinar hosted by InetSoft demonstrating the new features of its 2022 release.
Ben Williams: Hello, and welcome to the InetSoft 2022 New Release Webinar. It's been a while since our last product release webinar, so we're very excited to show all of you our latest product updates. My name is Ben Williams, I work in marketing here at InetSoft. With me here is Katie Roussey, who is a Systems Engineer at InetSoft. This webinar will mostly focus on what's new in the 2022 Release, but it's also going to feature some important updates from the last 2 releases. I'm going to briefly summarize these updates, and then Katie is going to demonstrate them and describe them in greater detail. There's also going to be a question and answer period at the end. So if you have any questions, you can enter them at any time. We will answer as many of your questions as we can. If we don't get to your question, we will answer you privately via email.


New Dashboard Chart Types
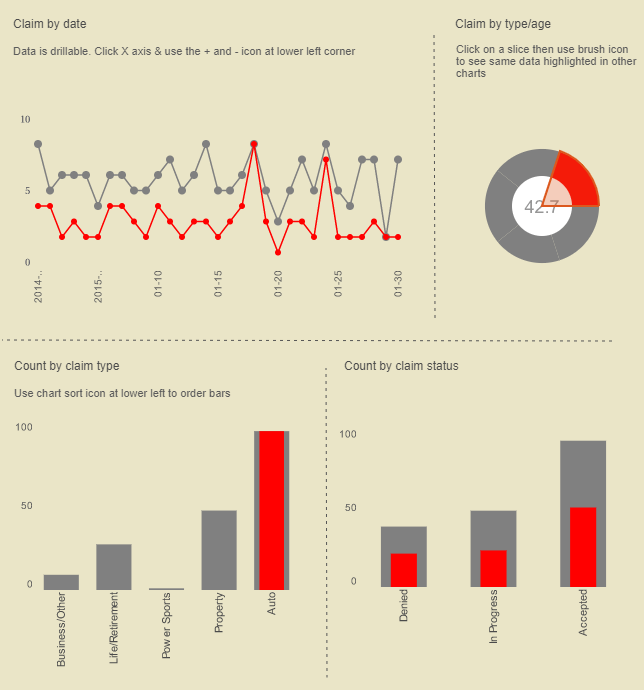
We have a number of new chart types in both the 2021 and the 2022 Releases. Katie is going to discuss many of these in greater detail, but I'll just briefly list them here. We have Jump Line, Hierarchy Tree, Funnel, Step Line, Interval Chart, Network & Circular Network and Gantt Charts. Now Gantt charts were an option in previous versions, but they required a script. So now they're just another option in the chart menu. In addition to these new chart types, we've expanded the capabilities of our map charts. Now our map charts can now run on Google Maps or Mapbox instead of just simple shape files. This enables interactive Zoom and other features. Also, maps can now have contour styling, enabling density to be visualized as it is on the map on the left hand side that you can see here.
What is a Contour Chart?
Contour plotting is a way to show a three-dimensional surface on a two-dimensional plane. InetSoft's 2022 release of StyleBI includes contour plotting on maps and scatter plots.
Data Model Updates
Next is our update to web based data models in Version 20.1. We have a new user interface for both the Physical Views and Logical Models, both of which can now be managed in the web portal for those with the appropriate permissions. This previously required one to have Style Studio on their desktop, but it can now be done entirely in the web. This builds upon the web based data models that were enabled by previous product releases.

Analytic Date Comparison Features
Next is an update to our Date Comparison features. This update facilitate flexible comparisons of different date groupings. A lot of custom date comparisons which previously required going into the data worksheet can now be done entirely within the dashboard. Our Enterprise Manager Task Scheduler has been updated, you can now schedule tasks by groups of users, instead of having to add individual users each time. While designing in Visual Composer, we now have a console that will capture high level warnings and errors as they happen during design. This allows designers to see the errors that occur without having to go into Enterprise Manager. We've also revised our back end storage structure with a new DSL interface for extracting and updating files. This improves stability in scalable environments.
Now I'm going to switch over to Katie, so she can discuss the updates in greater detail, and demonstrate some of the new features. Once again if you have any questions, just enter those into the questions and answer panel at anytime.
Web Based Data Models
Katie Roussey:We'll begin with enhancement of building Data Models in the web portal, instead of having to do them in Style Studio. Now you will still be able to create, manage and maintain data models within Style Studio, but if you choose to give security permissions to specific users, they can edit, manage, maintain, or create from scratch, data models as well as the Virtual Private models that can sit on top of them for data security. So within the User Portal, given an appropriate permissions, I can create a Physical View. Now, there will be a slight difference in terms of user experience compared to building a Data Model in Style Studio. It's not exactly drag and drop. Instead, you're actually checking off the particular tables and views to include.
We did a little bit more of a compact style for modeling the joints, where you can always expand and see the particular fields that are in that table or view. But it's not fully expanded all the time. To define an appropriate join between two tables, you're able to select the join handler, drag and drop. It will bring forward a join dialog so that way you can ensure that you're doing the appropriate join, whether on different columns, whether there's more than one, you can define that through drag and drop, selecting the existing join, removing it or potentially adjusting it, it will give some visual representation of the join type adjustment between two tables or views.
Physical Views
From there, you can go back into the modeling portion of the physical location. So I can continue to use drag and drop to map the appropriate join relationships. Just like within Style Studio, if you need to create a special SQL inline view, you can do so. We also do have horizontal auto layout or vertical auto layout that you can leverage instead of self-positioning the various tables and views that you're including in your Physical View. So there's still drag and drop point and click, but just a few differences in steps. We've also added a really nice ability for when you select a particular table, you can see the join relationship of what is going out from that particular table. This way, you can always double check that it's on the appropriate columns.

Logical Models
Once you have a Data Model created, you can go ahead and add a Logical Model to that Physical View. That's the second stage within your Data Model. You can select whichever Physical View that you have explicitly saved to use. Once you've done that step, instead of right click menus, we just have simple Select to Add, Add Elements, that I can start with my entities. So I'm going to be able to create my different organizational entities that I want to select, various fields to be exposed as attributes within. So it's all just going through a checklist in a simple step by step almost wizard like design. I can always come back in and expose additional attributes.
I can add expression fields, I can add additional entities, I can select attributes that I've exposed, and take a minute to change aliases, or potentially update the mapping as to which physical column it should go back to. I can set up default formatting and the auto drill all like you could within the Logical Model creation interface of Style Studio. So you can create from scratch or you can edit, modify and maintain existing Data Models that had previously been created for your relational data sources.
We do continue to add general enhancements to the various different web data sources, API data sources that we are supporting. And you can query those within the worksheet. But having the flexibility to build out the extensive data model with the databases that you're connecting to will give you a lot more flexibility than when you always had to go back to Style Studio.
Continue the InetSoft 2022 New Release Webinar here.
