What is the Difference Between Business Intelligence and Business Analytics?
What is the difference between business intelligence and business analytics? Since the two words are often incorrectly used interchangeably, the distinction can be confusing. Business intelligence is an umbrella term that refers to the methods, processes, and technologies which organizations use to turn large amounts of data into actionable information.
This includes analytics, data warehousing, performance management, and other technologies that provide historical, current, and predictive views of an organization's operation. Business analytics consists of the discovery of meaningful patterns in data, using statistics, computer programming, and operations research. Analytics can therefore be described as the prescriptive and predictive function of business intelligence reporting.
InetSoft's StyleBI Includes Visual Analytics Software
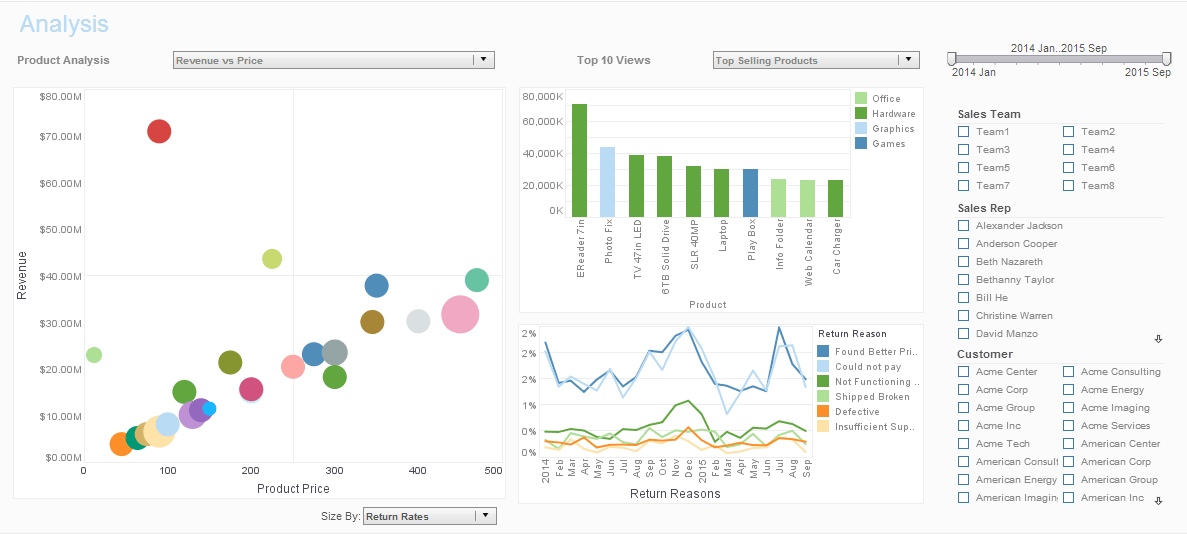
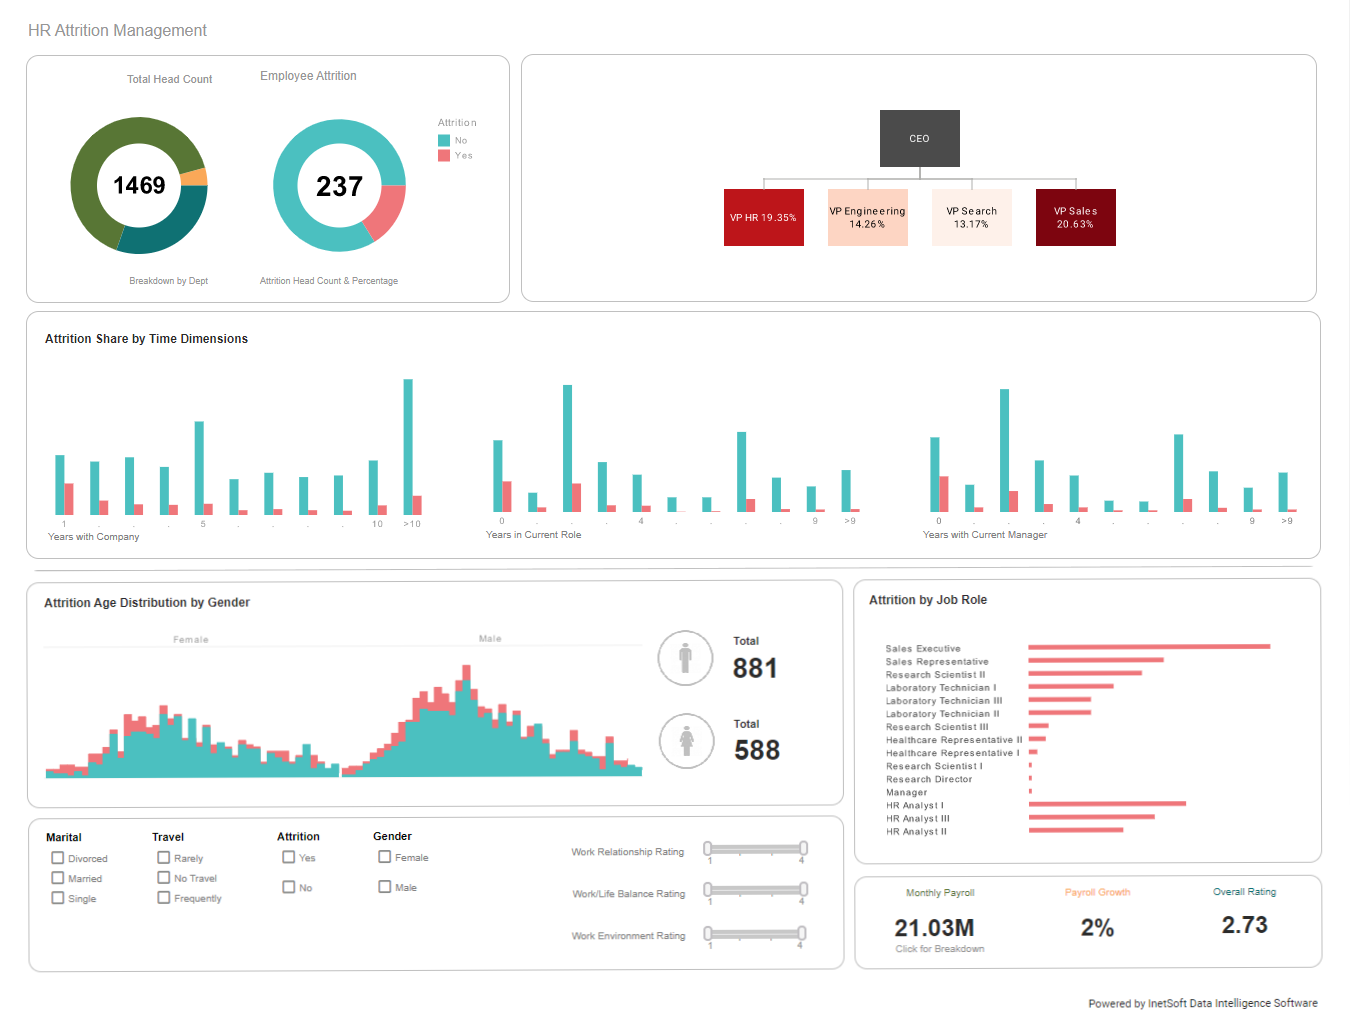
StyleBI is a business intelligence platform which includes sophisticated analytics software. InetSoft's analytics applications are designed to be used easily by operational users, not just business analysts. The analytic dashboard makes ad-hoc analysis simple by allowing data mashups to be determined by the end-user.
InetSoft's StyleBI dashboards can also be connected to Google Ads and Analytics, enabling more effective analyses than would be possible with the applications themselves. In addition, you get better KPI dashboarding with a Web-based drag-and-drop design tool that lets you chart any data including custom conversion types.
Why StyleBI Open Source Is a Smart Choice for Analytics
StyleBI Open Source is a cloud-native business intelligence platform designed for flexibility, speed, and scalability. It combines a data transformation pipeline with a visualization engine, making it a powerful tool for organizations seeking cost-effective analytics solutions.
Key Advantages
- Cost Efficiency: As an open-source tool, StyleBI eliminates licensing fees, making it ideal for startups, nonprofits, and budget-conscious teams.
- Rapid Deployment: Built as a lightweight Docker container, it can be deployed quickly on local machines or cloud platforms with minimal setup.
- Integrated Pipeline: The platform includes both data transformation and visualization components, streamlining the analytics workflow.
- Self-Service Features: Users can create dashboards and reports without needing deep technical expertise, thanks to its machine-assisted design tools.
- Scalability: StyleBI supports elastic scaling in cloud environments like AWS, Azure, and GCP, making it suitable for growing data needs.
- Security: Fine-grained access controls and visual-layer security help protect sensitive data while enabling collaboration.
- Community Support: As an open-source project, StyleBI benefits from community contributions, frequent updates, and transparent development.
Use Cases
- Internal reporting for small and medium-sized businesses
- Embedded analytics in SaaS platforms
- Custom dashboards for niche industries
- Rapid prototyping of data applications
More Articles About Analytics
-
Report Wizard Tools
InetSoft’s ad hoc report wizard guides users step by step, allowing creation of reports without needing programming or technical skills. It democratizes reporting by making it possible for non‑technical business users, analysts, and even small business owners to generate meaningful reports. The intuitive interface empowers faster decision making without reliance on IT. -
Drag‑and‑Drop Interface
StyleBI offers a drag‑and‑drop report writer that eliminates the coding barrier, enabling analysts—even with little or no technical training—to build complex reports. Business users can pull fields into templates directly, while more technical users still have the option to tweak SQL queries. This hybrid approach allows diverse users to generate insights efficiently. -
Empowering Business Users
Self‑Service BI from InetSoft is designed to empower business users—especially those without technical expertise—by simplifying data integration and exploration. It reduces IT bottlenecks and accelerates insight discovery through interactive dashboards and standardized reporting. Organizations benefit from streamlined workflows and lower support costs. -
Visual Data Analysis
InetSoft’s visual data analysis tools give users with just a basic Excel understanding the power to explore and visualize data without IT support. Interactive dashboards allow non‑technical users to spot trends, correlations, and anomalies in real time. The self‑service model dramatically speeds up decision making and reduces dependency on technical teams. -
DIY Your BI
The “DIY BI” article highlights the risk of homegrown BI solutions—often difficult to interpret without technical know‑how—and positions InetSoft as an easy alternative that requires no scripting. With drag‑and‑drop dashboards, users can create and mash up data from multiple sources independently. This autonomy saves time, reduces frustration, and enables faster business insights. -
No Technical Skill Required
InetSoft’s online data visualizer enables both business and casual users to build professional dashboards and visualizations without any technical skill. Users familiar with Excel can deploy this tool in just a few clicks, making complex data accessible to a wider audience. The visual interface supports real-time updates and collaboration across teams. -
Without Deep Technical Expertise
The intuitive data exploration app is tailored for business users and analysts who lack deep technical background, featuring drag‑and‑drop visuals and live previews. It suggests joins between data sources, offers smart profiling, filtering, and drill-down—all without SQL. This allows users to navigate, understand, and interact with data easily across devices. -
Point‑and‑Click Actions
InetSoft’s single data discovery application enables users to assemble dashboards and reports via point‑and‑click, eliminating the wait for IT assistance. Users access, author, and explore data on their own, connecting to various sources like APIs and XML feeds without technical setup. This vastly improves responsiveness and self‑service capabilities. -
Without Requiring Extensive
Expertise
In comparing to other CPM solutions, the article notes that InetSoft enables flexible, self‑service analytics “without requiring extensive technical expertise or dependence on IT.” Users can swiftly generate dynamic reports and dashboards, while IT overhead is reduced. This makes it especially appealing for organizations that need agile, autonomous reporting. -
Hands‑On Data Exploration
InetSoft emphasizes hands‑on data exploration for non‑technical users, enabling real-time interaction with dashboards without IT. Users with minimal skills can filter, drill down, and visualize metrics easily. The tool's design promotes faster insight gathering and broader user adoption.


