Dashboards and Visualizations for Facebook Ads Manager
InetSoft's business intelligence dashboarding software connects to Facebook Ads Manager's data so that you can create interactive data visualizations to better analyze the vast amounts of performance data the application collects. In addition, you get better KPI dashboarding with a Web-based drag-and-drop design tool that lets you chart any data including custom conversion types.
Facebook provides good basic dashboards and drill-down reporting features, but they are quite limiting when compared to a professional dashboard reporting solution like InetSoft's. Particularly when analyzing multiple dimensions in large data sets such as your Web site traffic and PPC facebook advertising performance, you need more flexibility and interactivity.
With an easy-to-use visualization designer, you can quickly add selection lists, range sliders and calendar selectors to build an efficient way to monitor and explore your data. Even more powerful is the ability to mash up this data with other data in your enterprise, particularly your CRM data where lead and sales data are stored. Now you can track KPIs like CPL (cost per lead), CPO (cost per opportunity), and most importantly ROI (sales revenue associated with campaigns and keywords).
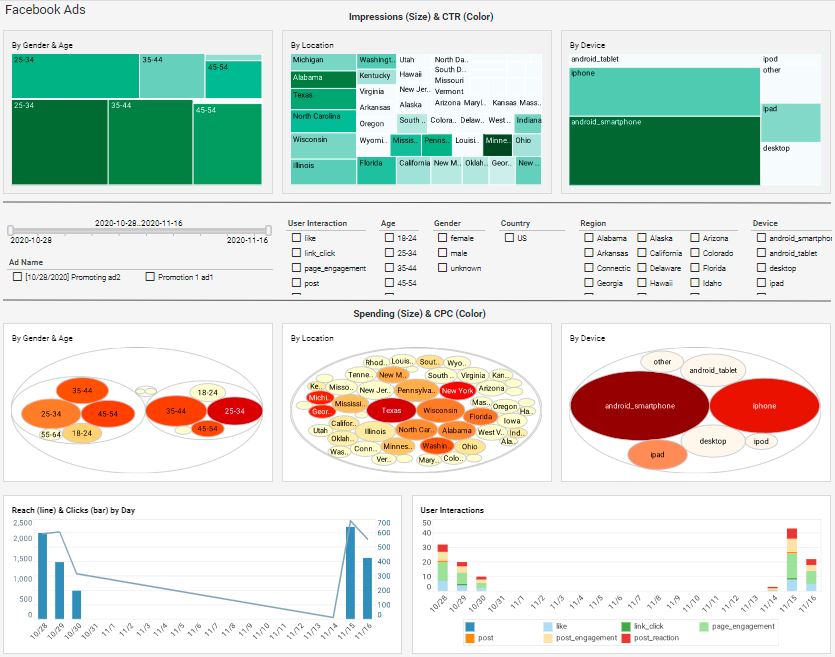
Example of a Facebook Ads Manager Visual Analysis
This example above illustrates the analysis of Facebook Ads performance. With Facebook's built-in reporting interface you can filter on all of the PPC metrics, but you can only sort on one at a time, which quickly frustrates you when you are trying to simultaneously maximize or minimize two of them, such as conversion rate and click through rate.
Dashboards Combining Organic and Paid Web Traffic
Despite being similar, dashboards displaying Facebook ad data and Facebook organic performance are only cosmetically unified, they cannot be displayed together in-product. With InetSoft's dashboard designer you have access to every single metric at every hierarchy, and you can mix and match them as desired.
Reporting on Custom Conversion Types
Having multiple conversion types such as quality visits or content interactions is a much more powerful way of measuring ROI for PPC, social media, and SEO activity, but Facebook doesnt combine them in it's reports. Even the custom report tool doesn't let you choose one at a time to analyze ad group or campaign performance. With InetSoft's business intelligence solution, you have unlimited flexibility.
Mashing Up Facebook Ads Manager with CRM, Financial and ERP Data
Probably the most powerful capability you get when you choose InetSoft for your marketing dashboard reporting front-end is the ability to mash up your Facebook data with your sales pipeline data. Now you can take into account lead quality and actual revenue generated in your ROI analyses.

What Are the Metrics Tracked on a Facebook Ads Dashboard?
Facebook Ads Manager provides a robust dashboard that enables advertisers to monitor, analyze, and optimize their campaigns. The dashboard includes a wide array of metrics that reflect performance across reach, engagement, conversions, and cost-efficiency. Understanding these metrics is essential for making data-driven decisions and improving return on ad spend (ROAS). Below is a comprehensive breakdown of the most important metrics tracked on the Facebook Ads dashboard, what they mean, and how to influence them.
1. Impressions
Definition: The number of times your ad was shown on a user’s screen. This includes multiple views by the same user.
How to Affect It: Increase your budget, expand your audience targeting, or improve your ad relevance score to win more placements in auctions.
2. Reach
Definition: The number of unique users who saw your ad at least once.
How to Affect It: Use broader targeting parameters, increase your bid, or optimize your ad for delivery to new audiences.
3. Frequency
Definition: The average number of times each person saw your ad.
How to Affect It: Adjust your budget and campaign duration. High frequency may lead to ad fatigue, so rotate creatives regularly.
4. Click-Through Rate (CTR)
Definition: The percentage of people who clicked on your ad after seeing it. Calculated as (Clicks ÷ Impressions) × 100.
How to Affect It: Improve ad copy, use compelling visuals, and ensure your call-to-action (CTA) is clear and relevant.
5. Cost Per Click (CPC)
Definition: The average cost you pay for each click on your ad.
How to Affect It: Increase ad relevance, improve targeting accuracy, and test different bidding strategies (manual vs. automatic).
6. Conversions
Definition: The number of desired actions taken by users, such as purchases, sign-ups, or downloads.
How to Affect It: Optimize landing pages, use conversion-focused creatives, and implement Facebook Pixel for accurate tracking.
7. Conversion Rate
Definition: The percentage of clicks that resulted in a conversion. Calculated as (Conversions ÷ Clicks) × 100.
How to Affect It: Improve user experience on your website, reduce page load time, and align ad messaging with landing page content.
8. Cost Per Conversion
Definition: The average cost to generate one conversion.
How to Affect It: Refine audience targeting, increase CTR, and optimize your funnel to reduce drop-offs.
9. Return on Ad Spend (ROAS)
Definition: The revenue generated for every dollar spent on ads. Calculated as (Revenue ÷ Ad Spend).
How to Affect It: Focus on high-performing audiences, use dynamic product ads, and test different creatives to maximize revenue.
10. Engagement
Definition: The total number of interactions with your ad, including likes, shares, comments, and clicks.
How to Affect It: Use emotionally resonant content, ask questions, and encourage user interaction through polls or contests.
11. Video Views
Definition: The number of times your video ad was watched for at least 3 seconds.
How to Affect It: Optimize the first 3 seconds of your video, use captions, and target users who engage with video content.
12. Cost Per Mille (CPM)
Definition: The cost per 1,000 impressions.
How to Affect It: Improve ad relevance and quality score, narrow your audience, and test different ad formats.
13. Ad Relevance Score (Now Replaced by Quality Ranking)
Definition: A measure of how relevant your ad is to your target audience. Facebook now uses three metrics: Quality Ranking, Engagement Rate Ranking, and Conversion Rate Ranking.
How to Affect It: Align your ad with audience interests, use high-quality visuals, and ensure your messaging is clear and compelling.
14. Link Clicks vs. All Clicks
Definition: Link clicks refer to clicks that take users to your destination URL. All clicks include likes, shares, and other interactions.
How to Affect It: Focus on link click optimization if your goal is traffic or conversions. Use strong CTAs and minimize distractions.
15. Leads
Definition: The number of users who submitted a form or expressed interest in your product or service.
How to Affect It: Use lead generation forms, offer incentives, and target warm audiences with retargeting campaigns.
16. Attribution Window
Definition: The time frame in which a conversion is credited to an ad after a user interacts with it.
How to Affect It: Choose the right attribution window based on your sales cycle. Short windows work for impulse buys; longer ones suit high-consideration products.
17. Audience Insights
Definition: Data about the demographics, interests, and behaviors of users interacting with your ads.
How to Affect It: Use insights to refine targeting, create lookalike audiences, and personalize ad content.
18. Budget Utilization
Definition: How much of your allocated budget has been spent.
How to Affect It: Monitor pacing, adjust bids, and set daily or lifetime budgets to control spend.
19. Placement Performance
Definition: Performance breakdown by ad placement (e.g., Facebook Feed, Instagram Stories, Audience Network).
How to Affect It: Analyze which placements yield the best results and allocate more budget to high-performing ones.
20. Funnel Drop-off Rates
Definition: The percentage of users who abandon the conversion process at each stage.
How to Affect It: Simplify forms, reduce steps, and provide clear value propositions at each stage.
Conclusion
Facebook Ads dashboard metrics offer a granular view of campaign performance. By understanding what each metric means and how to influence it, advertisers can optimize their strategies for better engagement, lower costs, and higher conversions. Regular testing, audience refinement, and creative iteration are key to maintaining strong performance across all metrics.