Google Calendar Dashboard Software
Managers foremost need project progress and coordination information such as dashboards displaying schedules and time tracking. However, the dashboards must be able to go beyond core schedule data to give a holistic view of all factors that can impact on-time, on-budget delivery.
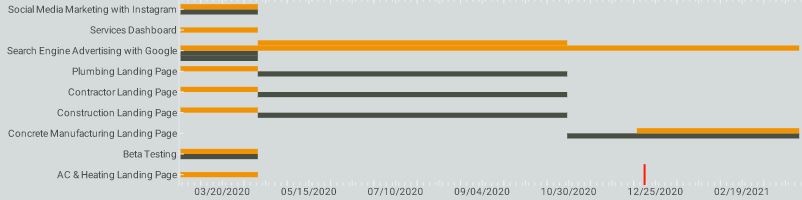
Google Calendar is a time-management and scheduling calendar service developed by Google. InetSoft's Style Intelligence comes with a custom Google Calendar data connector for incorporating schedule data.

Self-Service Google Calendar Dashboards
Set up all of your Google Calendar reports to run automatically, without sacrificing flexibility and control
Visualization dashboards are the most intuitive way to understand project information. However, not all dashboards are created equal. InetSoft's web app can easily connect to Google data to create self-service dashboards with rich built-in interactivity and customization.
For successfully delivery of projects, project managers must utilize all project related data, for example, supply chain and issue tracking system data. These systems are normally scattered. Some third party data may even be in Excel files. InetSoft's data mashup makes data processing a light-weight, business user self-serviceable process with great efficiency.

Online and Offline Reports
Make your reports accessible in the office, at home, or in the field.
Managers interact, share and collaborate with many parties. Visualization dashboards works excellently in most cases. Offline distributable reports become essential for many occasions where parties must share a large amount of information. InetSoft's pixel perfect, paginated document report engine is specifically designed for these cases.

Data Mashup and Drilldown - Flexible Automated Reporting
Give your user's the power to discover new insights into your company's data
With StyleBI, you won't have to run redundant reports because of limited data access. InetSoft's solution can mashup data from many diverse sources in real time, giving you maximum flexibility in report generation.
Reports can also be made interactive with drilldown capability, enabling managers to find further insights in the data. Certain patterns or thresholds in the data can be set to trigger automated alerts, ensuring that certain conditions do not escape the reader's attention.
Privacy and Limited Use of Your Data
Start for free or explore the commercial options. A free account requires only an email address to get started. InetSoft does not sell or share your personal information to any third parties. Our privacy policy is available here.
InetSoft's use and transfer to any other app or information received from Google APIs adheres to the Google API Services User Data Policy, including the Limited Use requirements.
InetSoft does not view or use your Google Calendar data for any reason. InetSoft's dashboard application only uses access to read Google Calendar data that you choose to display in the dashboards you create with the viewing permissions you control. InetSoft does not use any of your data to serve advertisements.
Per Google's requirements, the application does not allow humans to read this data unless we have your affirmative agreement for specific sheets, doing so is necessary for security purposes such as investigating abuse, to comply with applicable law, or for the App's internal operations and even then only when the data have been aggregated and anonymized.

Turn Google Calendar Into a Strategic Data Source
A midsize jute processor can turn Google Calendar into a strategic data source by feeding scheduling events into StyleBI to create unified management dashboards. Harvest windows, maintenance blocks, shipment cutoffs, and customer delivery appointments live as calendar events; when these are ingested alongside ERP production data, inventory levels, and quality metrics, the result is a single glass pane that shows not just what happened but what’s about to collide. Visualizing calendar-derived timestamps next to mill throughput and dyeing line yields uncovers timing mismatches—for example, a planned maintenance slot that overlaps a peak retting arrival—so decisions about overtime, temporary storage, or rerouting can be made before disruptions occur.
Operational managers benefit from temporal overlays and heatmaps that merge calendar density with process KPIs. A calendar-layered timeline highlights days with heavy outbound bookings and overlays expected millicurie-equivalent capacity (in jute terms: bale throughput per shift), making it simple to spot bottlenecks several weeks out. Conditional formatting and alert widgets can flag when scheduled deliveries exceed buffered inventory thresholds or when a sequence of calendar entries suggests an unsustainable loading pattern for a particular production line. The visual correlation between date-driven commitments and actual processing capability transforms reactive firefighting into proactive load balancing.
For workforce planning, StyleBI dashboards fed by Google Calendar make shift patterns and specialist availability explicit and actionable. Resource utilization panels join calendar events for certified machine operators, forklifts, and lab technicians with actual work orders and scrap rates, so supervisors can reassign certified staff to lines with fragile quality metrics or postpone low-priority runs until skilled labor is available. Filters let supervisors compare “what-if” scenarios—move a dye-bath job by one day, swap operator crews—and immediately see the downstream impact on on-time delivery and cost-per-bale, which helps keep labor costs in line without sacrificing quality.
Sales and customer-success teams use the same calendar-augmented dashboards to align promises with operational reality. A geo-enabled view overlays booked delivery dates from calendar events with carrier schedules, port windows, and export paperwork deadlines pulled from the order system, revealing which orders are at risk because of tight handoff windows. A small set of shared, role-specific dashboards—one for sales, one for operations, one for logistics—reduces cross-team email and ensures commitments reflect the processing facility’s true cadence and capacity.
Finally, leadership gains a strategic vantage by pairing calendar signals with trend analytics and cohort tracking. Seasonal calendar patterns (monsoon-related retting delays, festival-driven demand spikes) can be correlated year-over-year with yield variance, cost-per-ton, and customer churn to justify capital investments or alternate sourcing strategies. Embedded notes and drill-through links to the underlying calendar events make audits and post-mortems faster; when decisions are traceable to a specific meeting or schedule change, continuous improvement becomes measurable. In short, combining Google Calendar with StyleBI turns scattered dates into structured business signals that tighten planning, improve on-time performance, and lower the operational risk for a jute processing company.