Logistics Dashboard Reporting Software
In an increasingly competitive logistics environment, controlling and understanding logistics data can make a big difference in business activities, and using InetSoft's StyleBI logistics analytics tools will enable logistics managers to understand and take full control of their departments or organizations.
To help logistics managers accomplish this type of success, InetSoft has created a dashboard of professional logistics metrics that will not only ensure that logistics operational processes are running smoothly, but will help optimize costs while still maintaining quality service.
can make a big difference in business activities, and using InetSoft's StyleBI logistics analytics tools will enable logistics managers to understand and take full control of their departments or organizations.
To help logistics managers accomplish this type of success, InetSoft has created a dashboard of professional logistics metrics that will not only ensure that logistics operational processes are running smoothly, but will help optimize costs while still maintaining quality service.

InetSoft StyleBI uses the functionality of data mashup to combine multiple data sources in an easy and intuitive way. By using data mashup, logistics managers are able to create and combine data sources together to enrich their dataset. For example, by combining and visualizing the information of sales by different transportation methods and the popularity of transportation methods in different regions, logistics managers can tell which transportation method is the most profitable in specific countries and cities.
Through analyzing data from multiple sources, InetSoft Style Scope helps provide the logistics industry an at-a-glance view of their business performance from different perspectives.
Logistics Analytics
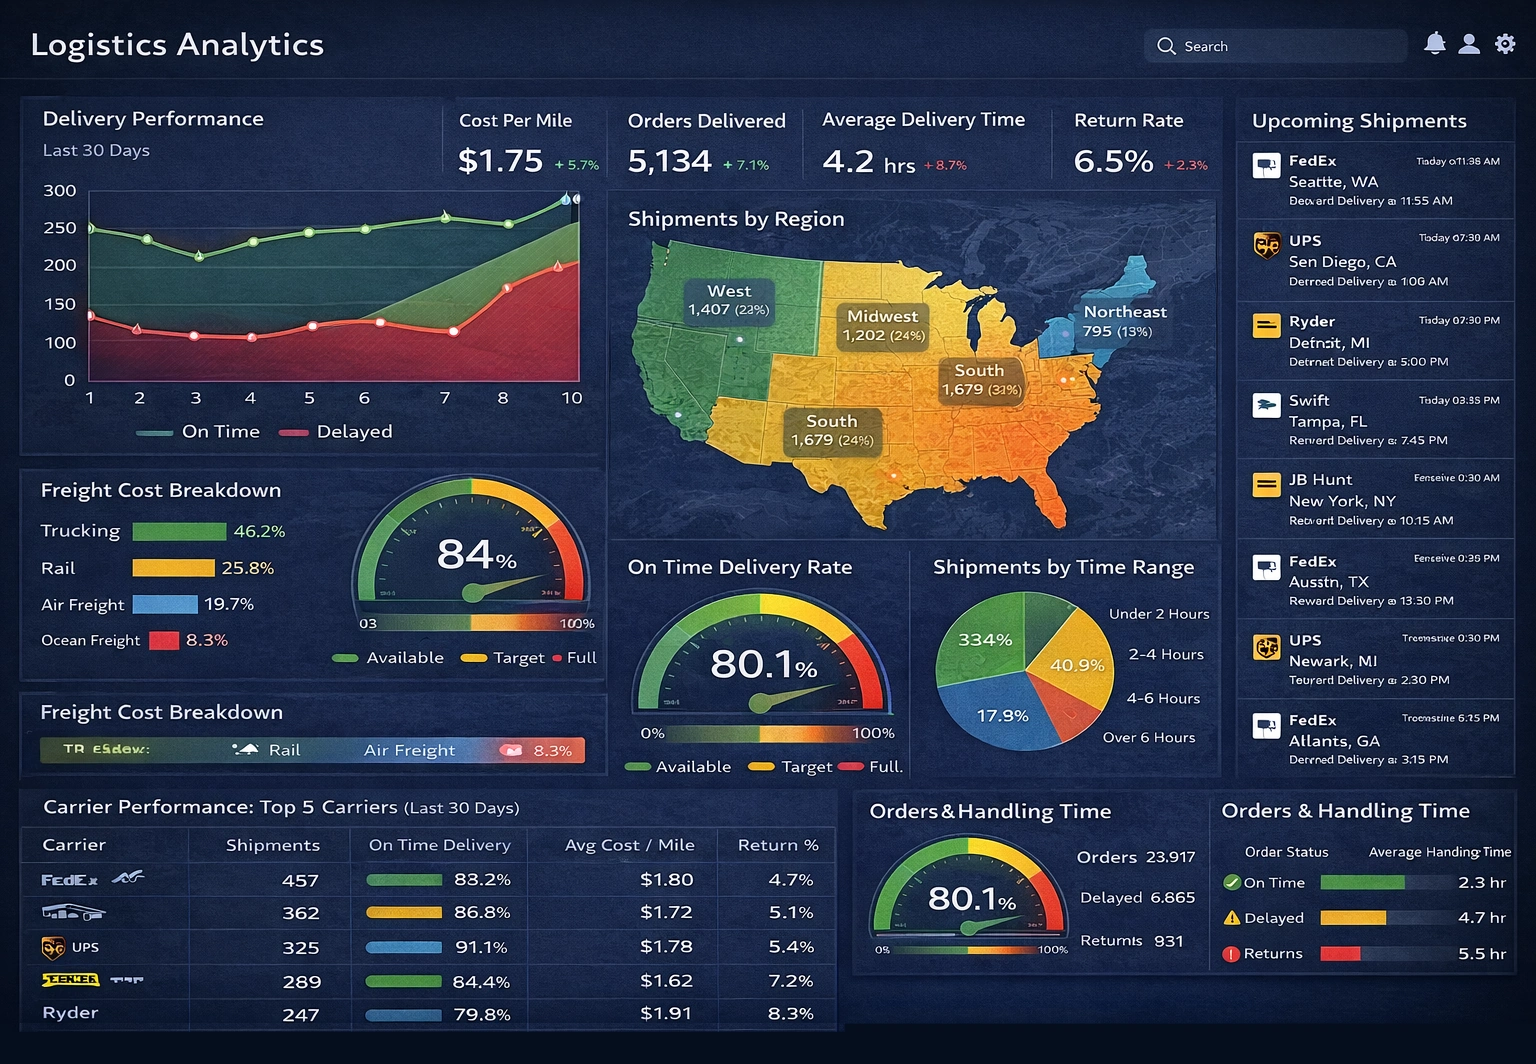
There are multiple functionalities on the InetSoft logistics dashboard which visualize data in diverse styles of charts, aggregates and filters. By using map charts to illustrate the global product shipment trends and setting a flyover treemap chart on the map chart, logistics managers would be able to find out which countries have the highest shipments and click the country on the map to further explore the top cities that have most logistics demand in that country.
Moreover, there is also a function to manage or calculate data through using simple script languages, like JavaScript and SQL queries, which will allow logistics managers to develop a large panel of criteria and logistic KPIs in order to improve the shipping experience (delivery status etc.) and finally lower transportation errors.
To maintain profitability in the logistics industry, finding the most profitable transportation method is critical. InetSoft Style Scope allows logistics managers to track, visualize and optimize all relevant logistic processes in an efficient way and get a sense of how the profit is affected by quarters, territory, regions and product size. InetSoft Style Scope with boundaryless self-service analytics provides actionable information that logistics managers can use to immediately lower cost and gain more profit. The powerful self-service analytics of InetSoft Style Scope also help businesses cover important KPIs.
Overall, the InetSoft application is a user-friendly interface that provides users with flexible and rich visual components to analyze data development trends.
How a Cold Chain Logistics Provider for Exotic Seafood Uses StyleBI for Dashboard Reporting
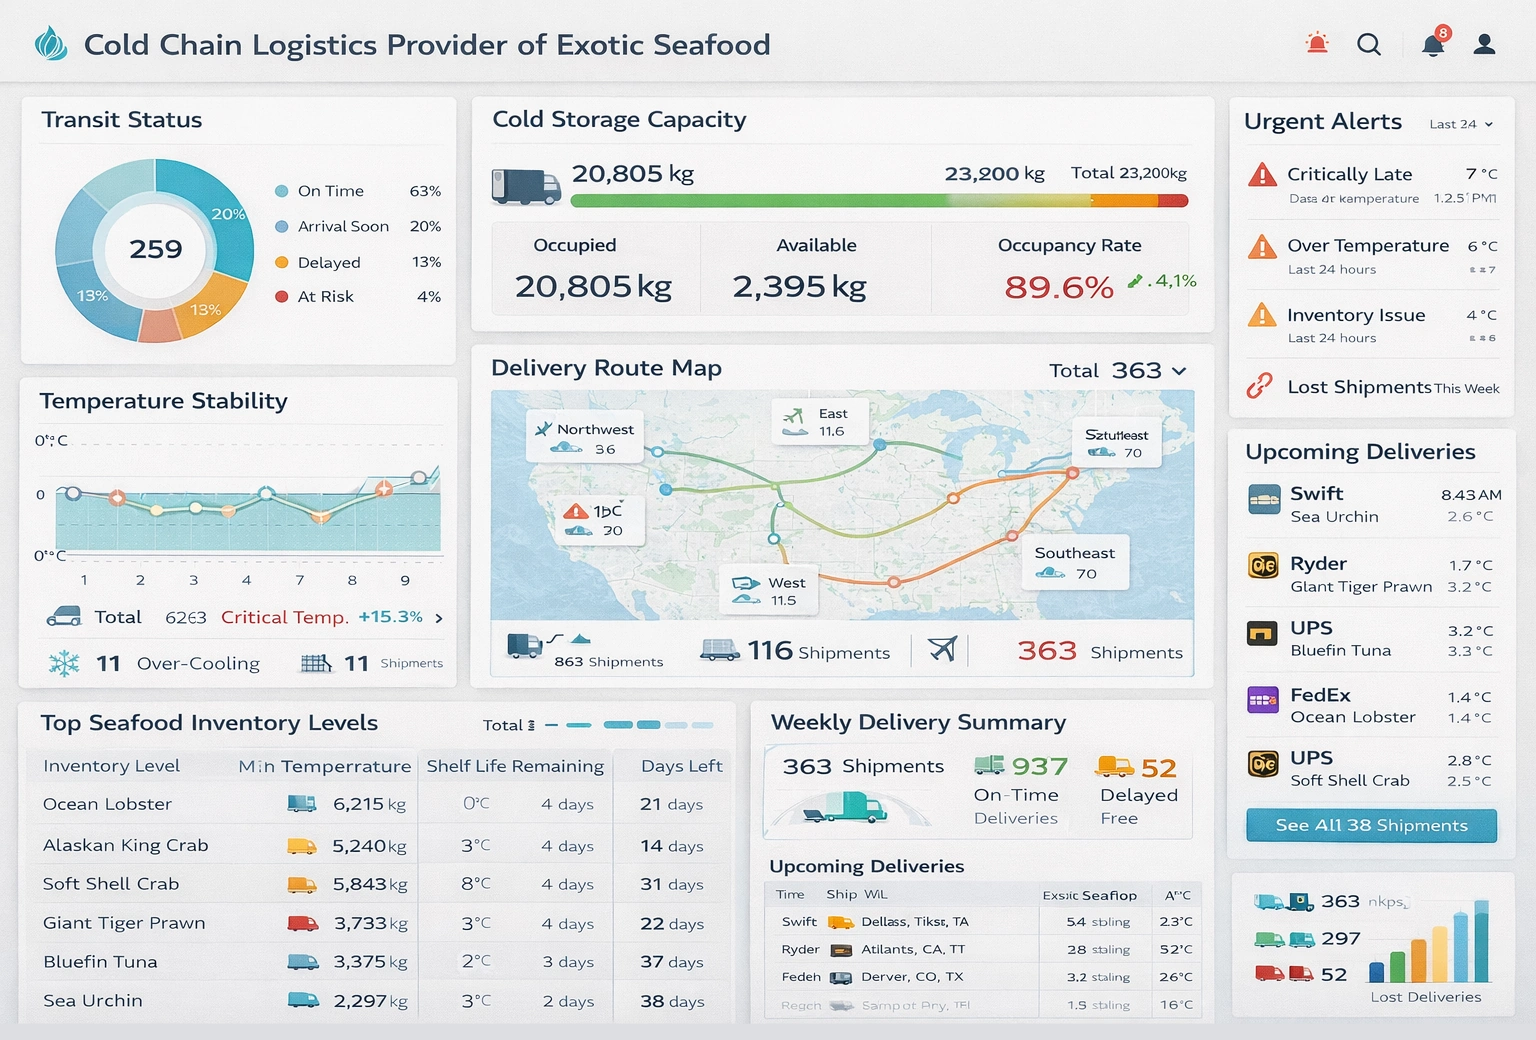
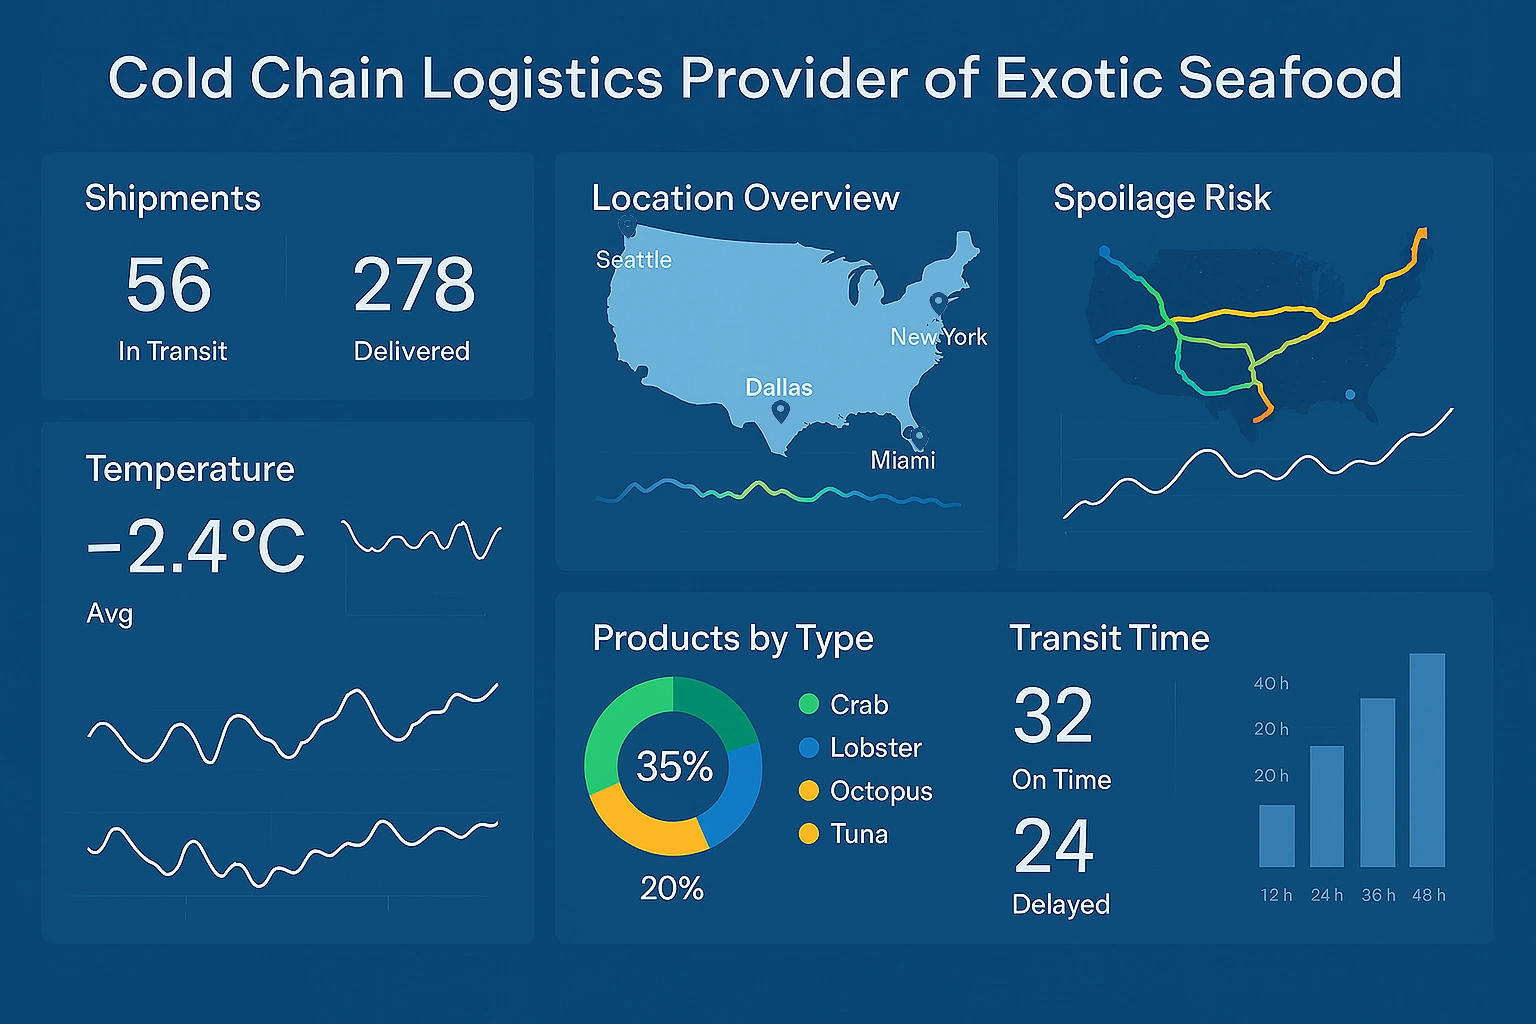
MarineFresh Logistics is a niche cold chain logistics provider specializing in the transportation of exotic seafood such as live lobsters, rare shellfish, and tropical fish to high-end restaurants, specialty markets, and international distributors. Maintaining the integrity of these perishable goods requires precise monitoring of temperature, humidity, oxygen levels, and transit times. To manage such a complex and time-sensitive operation, MarineFresh adopted the open source StyleBI platform for its dashboard reporting, transforming operational oversight and enabling real-time insights across its logistics network.
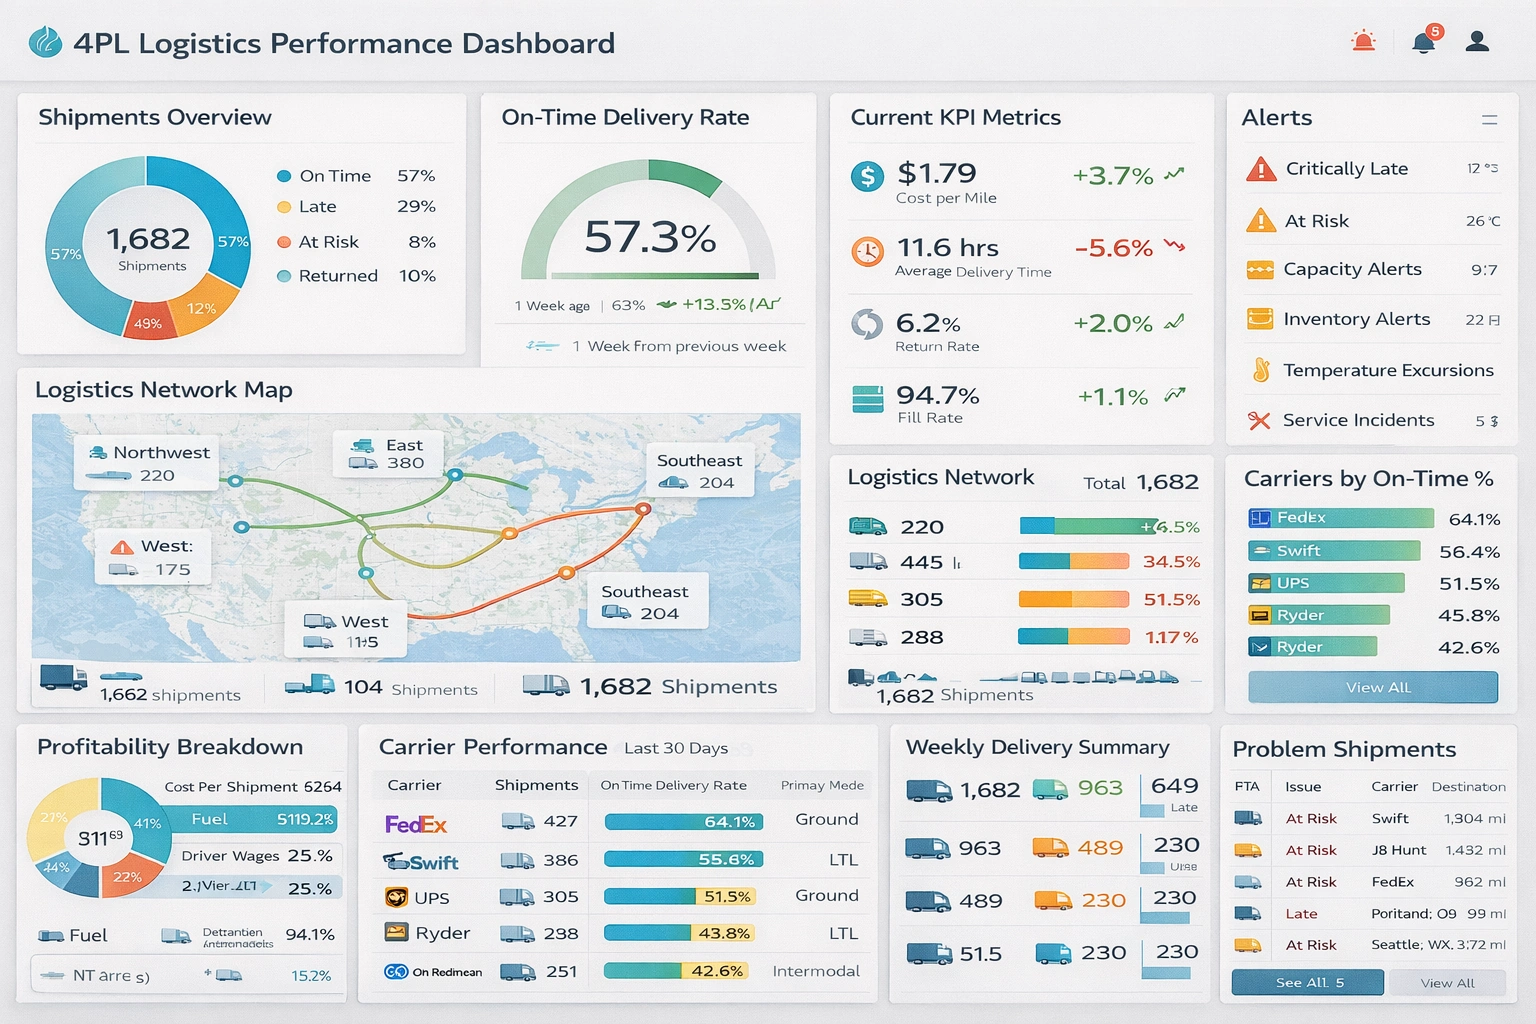
Prior to implementing StyleBI, MarineFresh relied on a combination of static reports, spreadsheets, and manual updates from temperature and tracking sensors. This fragmented approach created delays in identifying potential risks, such as a temperature excursion or delayed shipment, and made it difficult for management to have a unified view of operations. By consolidating sensor feeds, vehicle telematics, warehouse inventory systems, and delivery schedules into a single reporting platform, StyleBI allowed MarineFresh to create dynamic, interactive dashboards that provide an accurate and real-time picture of the entire cold chain.
One of the key advantages of StyleBI for MarineFresh is its ability to integrate multiple data sources without requiring extensive IT intervention. Live telemetry from refrigerated trucks, vessels, and air shipments feeds directly into the platform, while warehouse management systems track storage conditions and inventory levels. The dashboards aggregate this information to present a unified view of all shipments in transit, highlighting any deviations from optimal conditions. For instance, a sudden spike in temperature in a container triggers visual alerts on the dashboard, allowing operators to respond immediately and prevent product spoilage.
StyleBI’s interactive visualizations allow MarineFresh to drill down from high-level operational KPIs to detailed shipment-level data. Management can analyze trends in delivery times, temperature stability, and order fulfillment efficiency, identifying patterns that might indicate recurring issues or areas for improvement. Warehouse managers can monitor storage conditions and optimize the placement of high-value seafood, while fleet supervisors track vehicle performance and maintenance needs. By centralizing this data, StyleBI reduces the need for siloed reporting and manual cross-referencing, enhancing both speed and accuracy in decision-making.
The platform also supports advanced analytical capabilities, including predictive modeling and scenario analysis. MarineFresh uses historical data captured in StyleBI to forecast potential risks in the cold chain, such as periods of high temperature variation or delays in transit routes. By running "what-if" simulations, managers can test alternative shipping schedules, route changes, or vehicle assignments to mitigate these risks before they impact operations. This predictive capability has become crucial for ensuring consistent product quality and meeting customer expectations for freshness.
Collaboration is another significant benefit StyleBI brings to MarineFresh. Dashboards and reports can be shared across departments and with external partners, including restaurant clients, seafood suppliers, and customs authorities. By providing real-time access to shipment status and environmental conditions, stakeholders can plan ahead, make informed decisions, and reduce communication bottlenecks. Role-based access ensures that sensitive information, such as proprietary routes or pricing agreements, remains secure while still enabling transparency for operational efficiency.
The self-service nature of StyleBI empowers staff to explore data independently without requiring constant IT support. Operators can create ad hoc reports, monitor key performance indicators, and set automated alerts for specific thresholds, such as deviations in temperature or delayed deliveries. This autonomy not only accelerates response times but also fosters a culture of data-driven decision-making throughout the organization. Employees at all levels can interact with dashboards in real time, identify trends, and implement corrective actions before issues escalate.
Financial performance and operational ROI are also enhanced by StyleBI. By providing detailed visibility into shipment efficiency, fuel usage, maintenance costs, and inventory turnover, MarineFresh can identify cost-saving opportunities and optimize resource allocation. For example, dashboards highlight which routes are underperforming, which containers require frequent temperature adjustments, and which shipments consistently meet or exceed service level agreements. This insight allows the company to reduce waste, lower operational costs, and improve customer satisfaction.
External Resources for Logistics Dashboard Evaluators
1. Logistics Key Benchmarks from APQC
Logistics Key Benchmarks – APQC
This resource provides industry-wide KPI benchmarks for logistics operations, including inbound flow, outbound transportation, and warehousing. It helps organizations compare their performance against peers across sectors such as food, healthcare, and manufacturing. It is especially useful for dashboard designers who need validated metrics to track efficiency and cost-effectiveness.
2. Logistics Performance Index (LPI) by the World Bank
Logistics Performance Index – World Bank
The LPI is a global benchmarking tool that evaluates trade logistics performance across many countries. It combines survey data from freight operators with tracking indicators like maritime and postal flows. Dashboards that monitor international shipping, customs efficiency, and cross-border logistics KPIs can use this index for context and comparison.
3. Global Supply Chain Pressure Index (GSCPI) – Federal Reserve Bank of New York
Global Supply Chain Pressure Index – New York Fed
The GSCPI integrates transportation costs and manufacturing indicators to assess global supply chain stress. It is updated regularly and reflects disruptions from inflation, geopolitical events, and pandemic recovery. Dashboards can incorporate this index to contextualize logistics delays and volatility in near real time.
4. State of Logistics Report – CSCMP
State of Logistics Report – CSCMP
Published annually by CSCMP and Kearney, this report offers deep insights into U.S. logistics trends, costs, and sector performance. It highlights macroeconomic impacts on freight, warehousing, and last-mile delivery. Dashboard users can leverage this data to align KPIs with national logistics benchmarks and emerging challenges.