Mobile Reporting From InetSoft
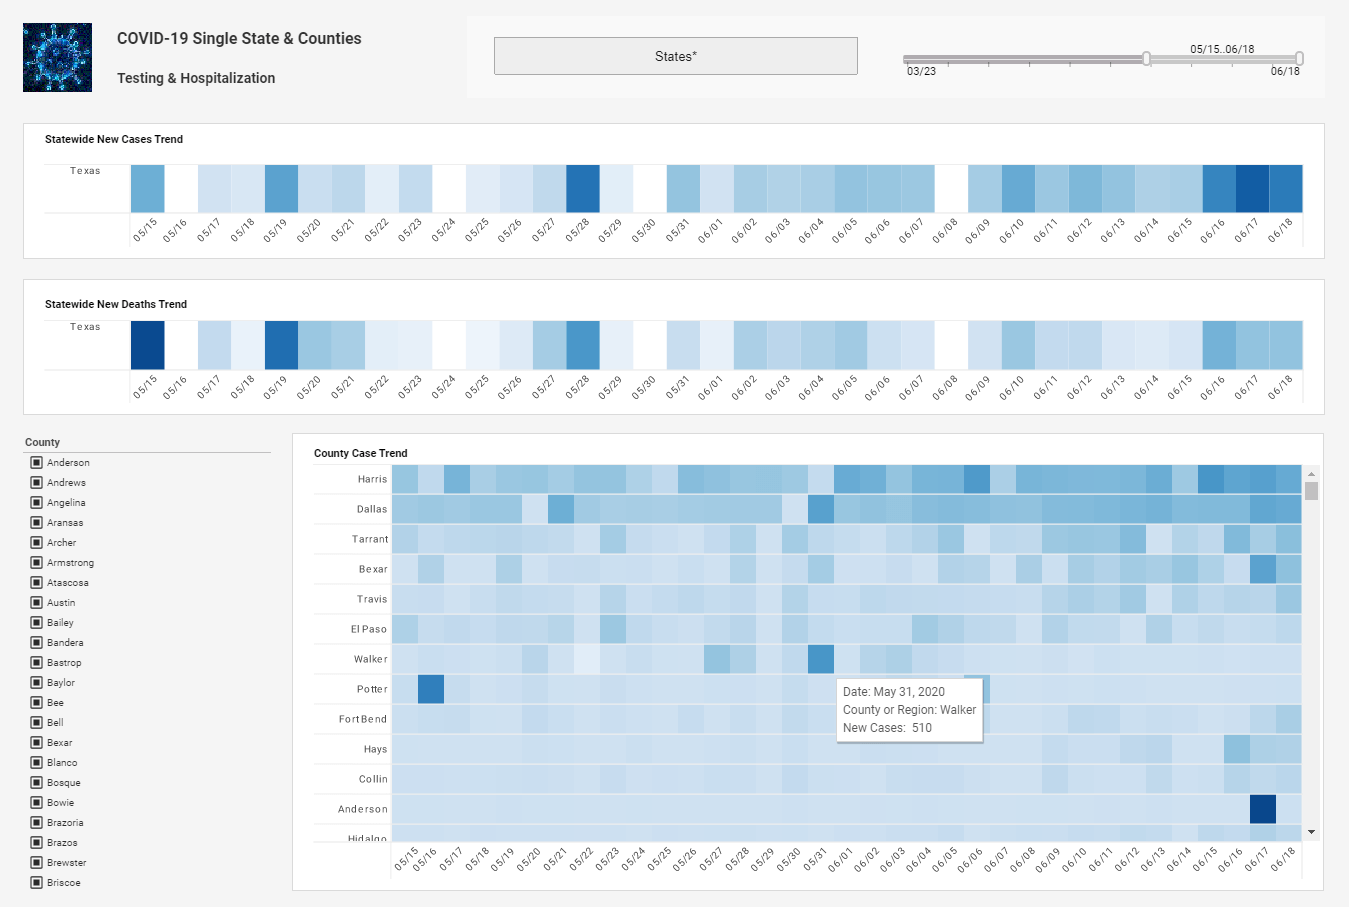
Looking for a BI solution that offers effective mobile reporting? Leaving the office doesn't have to mean leaving behind valuable, up-to-date information. InetSoft's StyleBI offers access to corporate information via a broad array of mobile devices. Executives can easily track KPI's regardless of where they are.
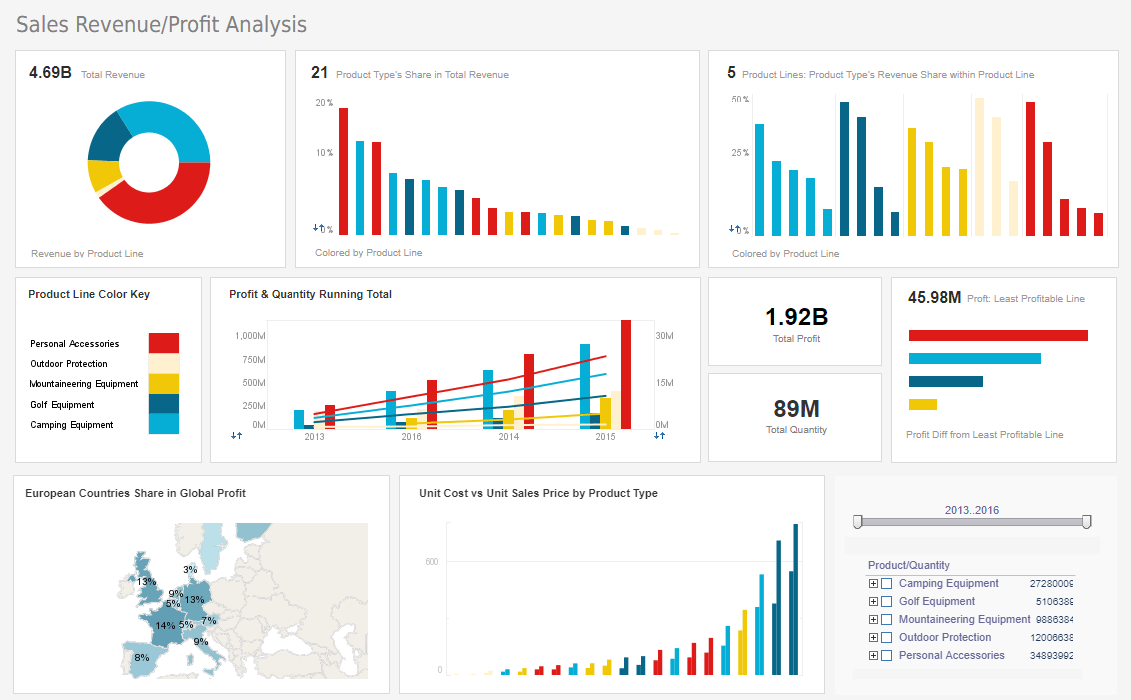
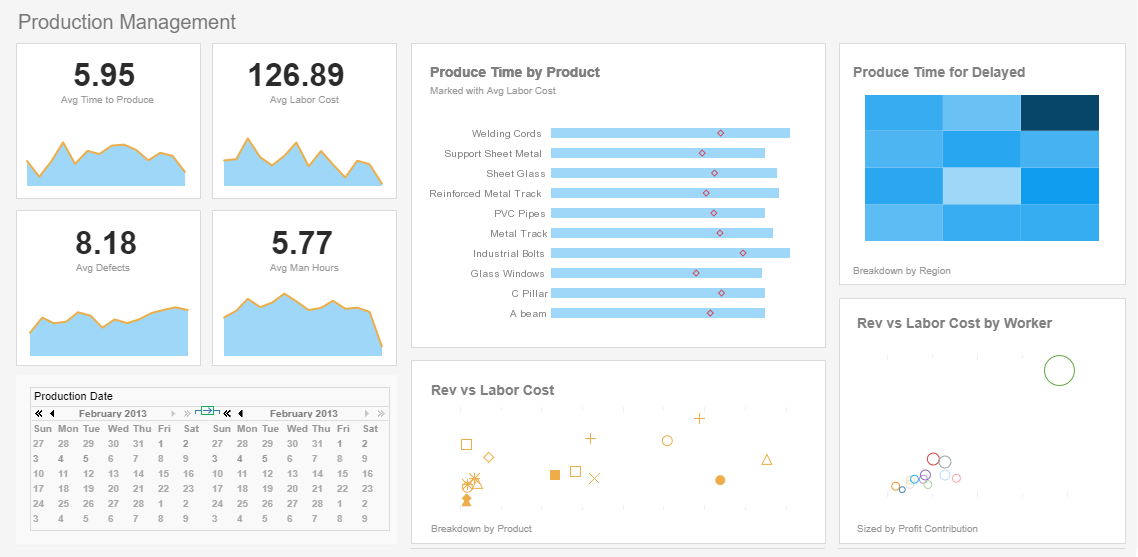
Having BI accessible via mobile is essential if you have executives who travel or employees who work out in the field. InetSoft's BI platform allows you to perform the same data explorations and stunning visualizations that can be done on a desktop computer.
Flexible mobile reporting allows for more than just alerts sent to your phone; real-time reporting tools let you interact with your data. When you have the power to not only access results, but to also leverage and explore data relationships on the go, you will maximize your performance.


Ease of Use Meets High Performance
- Easy to use and deploy
- Web-based interface enables access from anywhere
- Combine disparate sources of data
- Enables easy collaboration and information sharing
- Access to dashboards through multiple web-based devices including Android-based tablets, smartphones, iPads, and iPhones
- Track and measure Key Performance Indicators
- Observe changing conditions in real-time
- Only basic knowledge of databases and Excel-level skills are needed
- Interactive dashboards and drillable reports can be rapidly built based on mashed-up data
- Connectivity to relational databases (JDBC), multidimensional databases, Hadoop/HIVE, XML, SOAP, Java beans (POJO), Microsoft Excel, flat files, OLAP cubes, SAP, PeopleSoft, JD Edwards, salesforce.com, Siebel CRM, Postgres, Google AdWords and Analytics, Microsoft SharePoint, and more
About InetSoft
Since 1996 InetSoft has been delivering easy, agile, and robust business intelligence software that makes it possible for organizations and solution providers of all sizes to deploy or embed full-featured business intelligence solutions. Application highlights include visually-compelling and interactive dashboards that ensure greater end-user adoption plus pixel-perfect report generation, scheduling, and bursting.
InetSoft's patent-pending Data Block technology enables productive reuse of queries and a unique capability for end-user defined data mashup. This capability combined with efficient information access enabled by InetSoft's visual analysis technologies allows maximum self-service that benefits the average business user, the IT administrator, and the developer. InetSoft solutions have been deployed at over 5,000 organizations worldwide, including 25% of Fortune 500 companies, spanning all types of industries.
10 InetSoft Articles About Mobile
- Accessible On Virtually All
Explains InetSoft’s approach to delivering dashboards and reports that work across smartphones, tablets, and laptops without reauthoring. Describes the native and web options that make deployment to mixed-device fleets straightforward. Includes practical notes on when to design mobile-optimized layouts versus relying on responsive behavior.
-
Cloud Based Mobile Business
An overview of a 100% cloud-based mobile BI platform and what that means for IT operations and end users. Covers device support, deployment models, and how cloud hosting simplifies access for distributed workforces. Emphasizes rapid provisioning and low-friction demos for executive stakeholders.
-
Support For Mobile BI
Details the product-level features that deepen mobile support—HTML5 rendering, native app wrappers, and touch-friendly components. Describes how mobile-specific constraints (screen size, intermittent connectivity) are addressed by server-side mashups and careful UX choices. Offers guidance for organizations moving from legacy Flash or desktop-only views to modern mobile experiences.
-
Mobile Optimized Version
Shows examples and patterns for creating dashboards that are explicitly optimized for tablets and phones while sharing the same semantic layer as desktop views. The article walks through layout decisions, control spacing for touch, and when to offer a simplified mobile-only view. It also explains how to reuse data mashups to avoid duplicate development effort.
-
Mobile BI Dashboards
A gallery of mobile dashboard samples spanning sales, operations, and executive use cases to illustrate practical mobile BI patterns. Each sample demonstrates how KPIs, trendlines, and filtered lists behave on smaller screens. Useful as a design reference for teams building their first mobile-ready reports.
-
Access Corporate Information
Focuses on mobile reporting scenarios for executives and field staff who need timely KPIs outside the office. Discusses authentication, secure access, and choices for embedding dashboards in partner portals or internal mobile apps. Also highlights scheduling and alerting as alternatives to ad-hoc mobile queries.
-
Effective Mobile Visualization Tool
Explores visualization techniques that translate well to mobile: compact sparklines, stacked indicators, and single-tile KPI cards. Covers tradeoffs between information density and scannability, and recommends visualization types that preserve clarity on 4–10 inch displays. Includes tips for accessible color choices and labeling for touch interactions.
-
Key Performance Indicators
Examines how to surface the right KPIs on mobile—short, actionable metrics rather than long exploratory canvases. It recommends designing drill paths that move from a small set of mobile tiles into richer desktop-level analysis. The piece highlights the need for precomputed aggregates and careful caching to keep mobile response snappy.
-
Best Practices For Mobile
Summarizes proven best practices for mobile analytics projects including responsive layout, prioritized KPIs, and lightweight interactions. Encourages governance around which metrics appear in mobile views and suggests templates to accelerate consistent delivery across teams. Also touches on measurement of mobile adoption and refinement cycles.
-
Equip Your Users With Mobile BI
Discusses recent advances in mobile BI capabilities such as richer native components, improved offline behavior, and integrations with push/notification services. Shows how these capabilities enable new workflows for field teams and retail partners. Ends with practical recommendations for piloting mobile dashboards before broad rollout.


