InetSoft's Online Interactive Dashboard
Looking for a new way to keep track of performance and improve overall efficiency of any task? InetSoft's online interactive dashboard software has proven to be a highly effective business tool for both monitoring and analyzing data to meet the queries of any user.
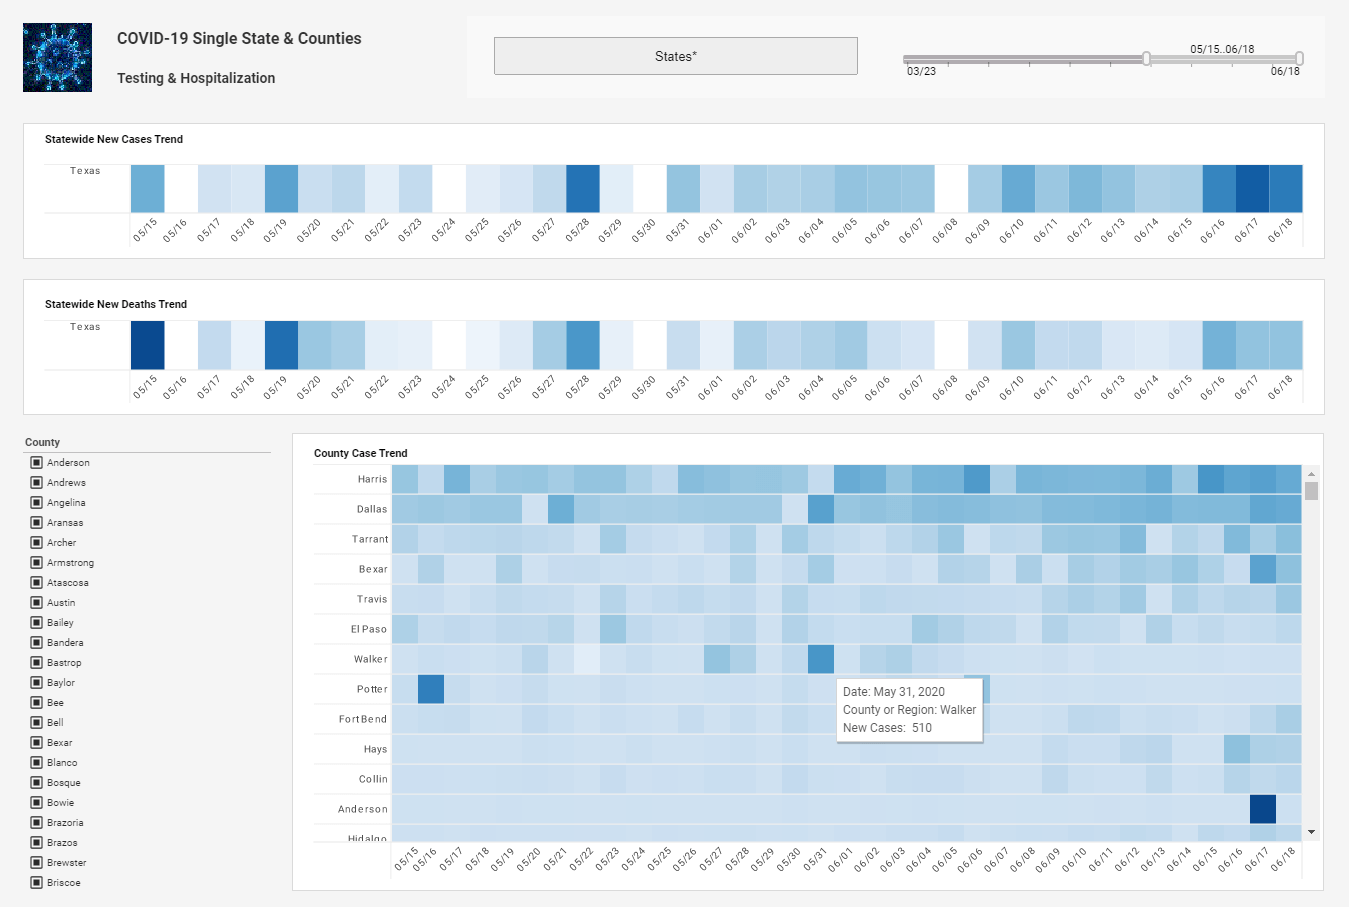
A dashboard is a visual display of the most important and relevant information in reference to one or more objectives, displayed on one screen so it can be viewed easily at a glance. This kind of software has been making the tasks of meeting goals and deadlines much easier for users to comprehend and grasp, as dashboards are much friendlier to understand than trying to comb through a report.
However, InetSoft has taken this idea to the next level with a 100% web-based unique, user-friendly interface that not only displays this information, but gives users the ability to interact with and manipulate their data for maximum self-service, without having to rely on any help from IT specialists. Anyone with a basic understanding of Microsoft Excel can begin making pixel-perfect dashboards in just a few clicks. In addition, having the software web-based means that users are not limited to the size of their database's memory, allowing for virtually unlimited dashboarding possibilities.
| #1 Ranking: Read how InetSoft was rated #1 for user adoption in G2's user survey-based index | Read More |
Online Dashboarding Options
With InetSoft's web-based server, you have the unique ability to choose where the data will be stored, without taking up massive amounts of storage on your personal computer. Dashboards can be accessed through a web browser, whether installed on your machine, on a remote server miles away or at a server in the company's local intranet.
InetSoft's online reporting system can be installed and ran in the cloud, on a remote server provided by Amazon web services or any other provider. Connections to a company's local data set can be set up so the software in the cloud pulls in data from any number of sources, no matter the location, meaning that data can be seamlessly accessed and updated in real-time at any time from any location.
Easy Online Interactivity
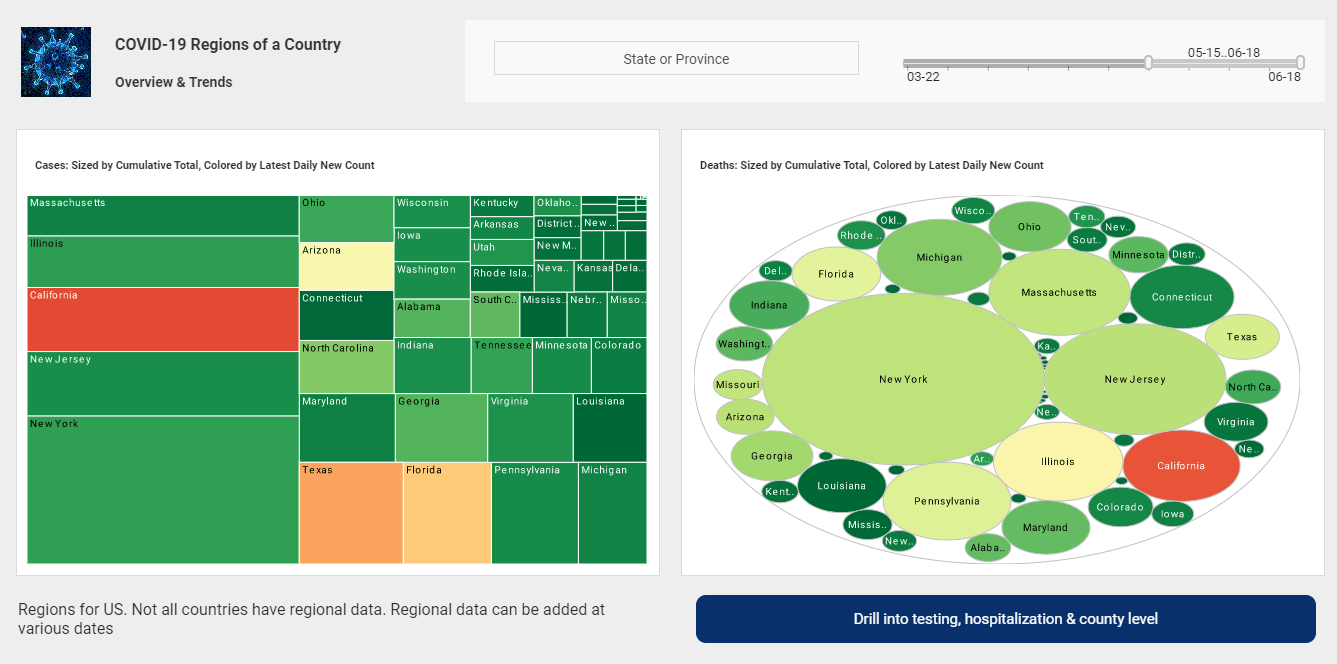
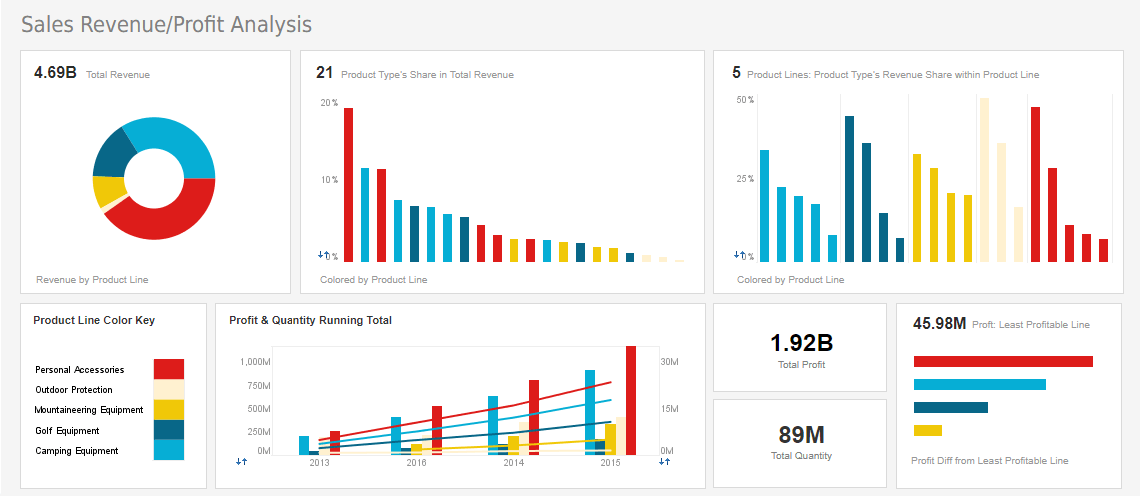
A key aspect of InetSoft's dashboard software is that it allows users to add powerful interactivity without complicated programming, allowing for new level of exploration and insight into data. Users are free to choose from various types of graphs and charts, as well as tables, crosstabs, and gauges. From there, users can manipulate the size, color, text elements, and layout of an element with unlimited design options.
The best part? Once the data is manipulated, you can either save those changes as a bookmark, or simply press the escape button and start over again if you did not find the correlations you were looking for. There is no need to have to deal with multiple windows or mistakes in manipulating the data, because the dashboards can be interacted with right on the screen.
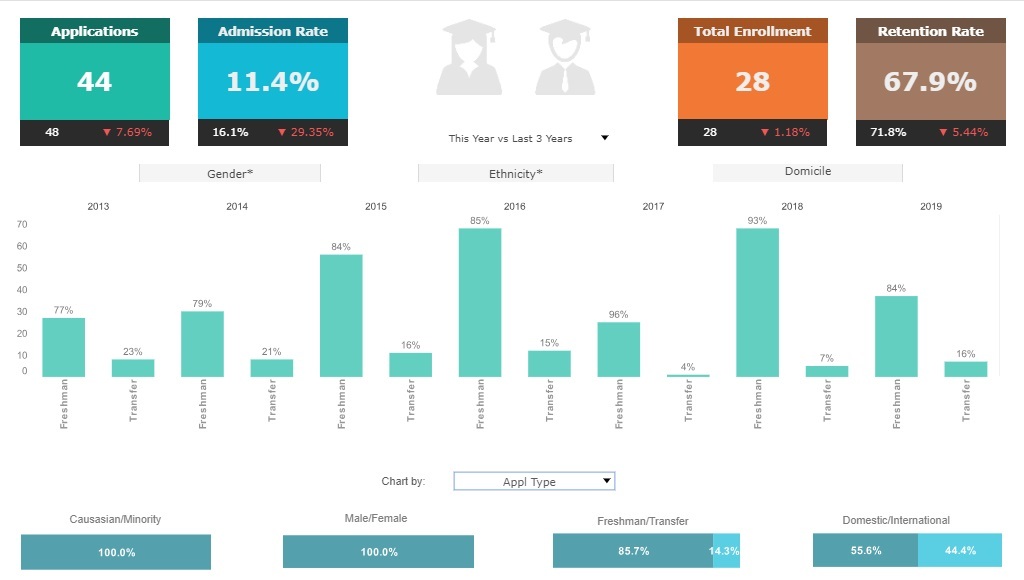
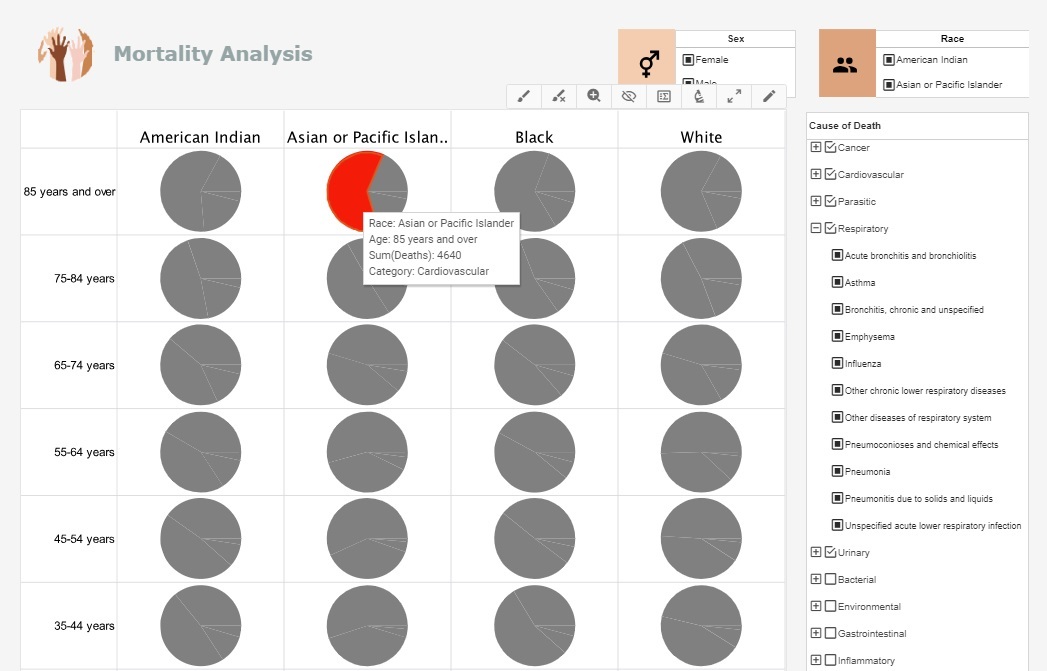
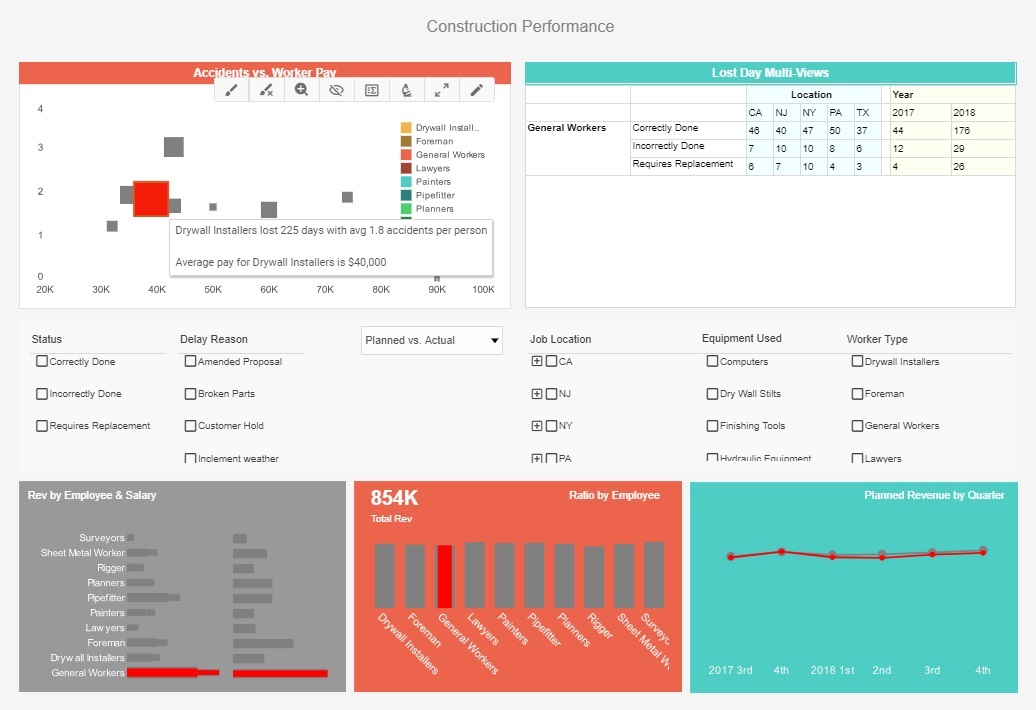
Interactive Dashboard Features
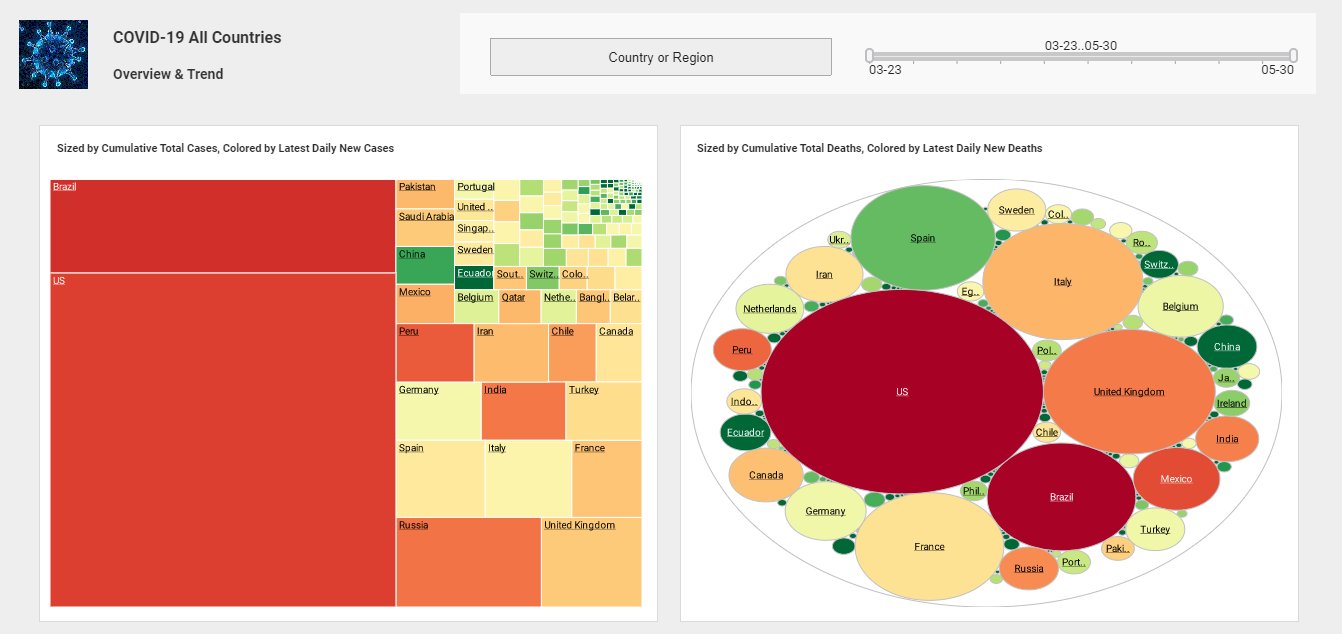
Users can utilize the brushing tool in order to highlight, isolate, and filter data according to various dimensions and measures in order to display only relevant information, as well as utilize InetSoft's multidimensional charting to add multiple dimensions or measures to a chart. Users can discover correlations by viewing the data represented in different colors, shapes, and sizes.
The more ways that data is plotted in a chart, the more possibility the user has for discovering new trends in the data. For example, while plotting a bubble chart, you may also notice that one certain color of bubbles are also the largest, and therefore discover a new trend between the measures and dimensions that were assigned to the color and size.
InetSoft's online interactive dashboards were created to offer maximum ease-of-use and flexibility to the user while still being powerful enough to create dashboards and reports that can meet any query that you may have. Give it a try- download a free version of InetSoft's software today!
About InetSoft
Since 1996 InetSoft has been delivering easy, agile, and robust business intelligence software that makes it possible for organizations and solution providers of all sizes to deploy or embed full-featured business intelligence solutions. Application highlights include visually-compelling and interactive dashboards that ensure greater end-user adoption plus pixel-perfect report generation, scheduling, and bursting. InetSoft's patent pending Data Block™ technology enables productive reuse of queries and a unique capability for end-user defined data mashup.
This capability combined with efficient information access enabled by InetSoft's visual analysis technologies allows maximum self-service that benefits the average business user, the IT administrator, and the developer. InetSoft was rated #1 in Butler Analytics Business Analytics Yearbook, and InetSoft's BI solutions have been deployed at over 5,000 organizations worldwide, including 25% of Fortune 500 companies, spanning all types of industries.
 |
Read why choosing InetSoft's cloud-flexible BI provides advantages over other BI options. |

