Publishing Analytics Dashboards
With the development of digital information over the past years, publishers have been enduring rapidly evolving challenges and opportunities in the digital space. Publishers have to find ways to adapt quickly to the market in order to turn informational challenges into revenue and opportunity. From bestsellers to reviews/ratings, from book genres to year published, publishers are dealing with more and more data streams and considerations in order to stay competitive.
Publishers posses a large amount of data. To analyze this data, there are many indicators for publishers to consider, including rankings, market share, dynamic sales varieties, inventory ratios and so on. These key performance indicators reflect various aspects of book sales from different perspectives by categories, and different publishers can choose effective indicator combinations according to their needs, to form a data system that reflects the status of published books.


In addition to the book sales data of particular editions, publishers will also focus on the sales, delivery, and store response of similar books in the national market. The sales volume and ranking of particular editions and the national market sub-category rankings are also of concern.
Publishers need powerful business intelligence technology to integrate enterprise resources, effectively control costs, and improve management efficiency. This publisher's dashboard by InetSoft would be the solution to help them save time and make better decisions.
With powerful analysis methodologies and the easy to use interface of the InetSoft application, publishers can create interactive charts, tables, and crosstabs from their publishing data. They can also add filters by genre, year published, rating, reviews number and so on. Here are a few key dashboard views that illustrate how publishers can use InetSoft analytics to understand the most popular authors and genre.
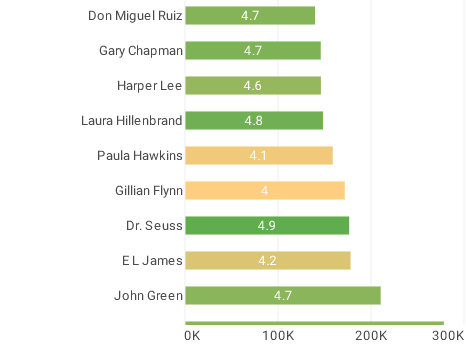
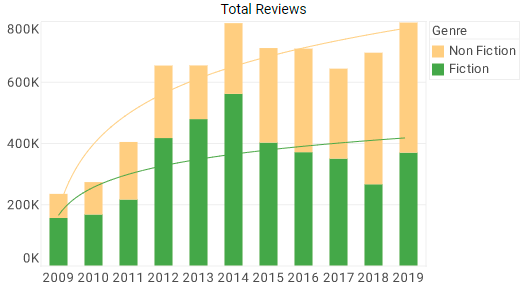
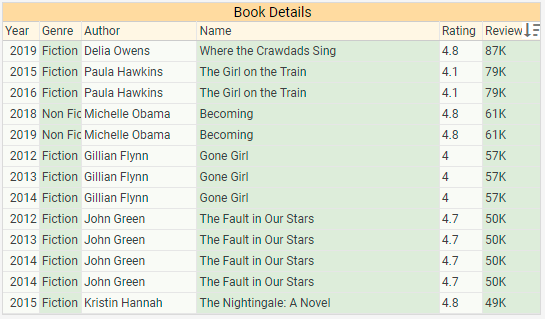
InetSoft's Media Analytics Dashboard
Using the above media analytics dashboard as an example, publishers can easily find out the top 20 authors by reviews through sorting. Based on this information, publishers can print and inventory more books that come from the most popular authors. By applying the genre filter, publishers can easily identify which kind of books are worth investments such as advertising, helping publishers improve their ROI.
The InetSoft media analytics dashboard gives publishers deeper insights into how books are performing based on different measures. In addition to use by publishing companies, it could also give self-publishing or freelance writers a sense of current trends that they could use as guidelines for their own creations. Overall, this InetSoft analysis enables the publishing industry to improve efficiency and make accurate decisions that would catalyze their success.

InetSoft's application is a holistic platform to analyze, plan, execute and report intuitive results and predictions in diverse industries.
Using intuitive visual data representations and tools provided by InetSoft Style Scope, users can produce graphs, charts, and other powerful visualization instruments that empower them to interpret their data and transform it into actionable insights that will benefit their business in many ways.
For the consideration of the overall book selling market and competition factors, InetSoft would be the intelligent tool to grasp the trends in the market data, and focus more on the indicators reflecting the overall market position and growth changes of the publishers, such as the market share and ranking, year-on-year and month-on-month growth changes.
From Pyramid Analytics to StyleBI: A Magazine Publishing Company Reinvents Reporting
A mid-sized magazine publishing company that had long relied on Pyramid Analytics to handle its reporting and data analysis struggled to keep pace with the rapidly changing media landscape. As the publishing landscape shifted toward digital-first models, the company found itself needing more flexibility, more intuitive dashboards, and broader integration with its growing ecosystem of systems. This led to a significant decision: replacing Pyramid Analytics with StyleBI as its primary reporting and business intelligence platform. The transition not only improved the quality of insights the company could derive but also transformed the way departments—from editorial to advertising—collaborated on data-driven strategies.
The Challenges of Modern Magazine Publishing
Magazine publishing has undergone seismic changes over the past two decades. Print circulation continues to decline, while digital readership, social media engagement, and online advertising now account for much of the revenue. For a publishing company, success depends on simultaneously managing multiple revenue streams: print subscriptions, digital subscriptions, digital advertising, sponsored content, and events. Each stream produces its own complex datasets, from web analytics and subscription churn rates to ad click-through metrics and event attendance figures. Publishing companies need not only to track these data points but also to understand how they interact with one another. For example, a spike in online readership might correspond with higher advertising revenue, but only if churn rates remain under control. Without comprehensive and dynamic reporting, these relationships are easy to miss.
For years, this particular publisher used Pyramid Analytics to create dashboards for circulation figures, ad performance, and financial reporting. The software provided a solid foundation and gave executives a structured way to access core metrics. However, as the company expanded its digital footprint, the shortcomings of Pyramid became more apparent. What was once adequate now felt rigid and slow in the face of constantly evolving reporting needs.

Limitations of Pyramid Analytics
Pyramid Analytics is a powerful BI platform, but for this publisher, several issues emerged. First, its integration capabilities were limited compared to what the business required. The company was pulling data from subscription platforms, Google Analytics, advertising networks, and a growing number of social media channels. Pyramid could connect to some of these, but combining them into a single coherent dashboard often required manual workarounds or extensive technical intervention from IT.
Second, the system was not particularly intuitive for editorial and advertising staff who lacked technical training. Editors wanted to quickly see which articles were driving the most conversions, while advertising executives wanted immediate insights into campaign performance. With Pyramid, producing such customized dashboards often required going through a centralized analytics team, slowing down decision-making and frustrating staff who needed answers in real time.
Finally, the reporting structure in Pyramid tended to be more static than dynamic. While it could handle traditional KPIs, it lacked the flexibility for exploratory analysis. The company increasingly needed to experiment with new revenue models and reader engagement strategies, which required a BI tool that could adapt rapidly to changing business questions.
Why StyleBI Was Chosen
The move to StyleBI was driven by the company’s need for a more flexible, user-friendly, and integrative solution. StyleBI’s architecture allowed the publisher to unify data from diverse sources—subscription platforms, content management systems, ad servers, and finance tools—into a single reporting environment. Unlike Pyramid Analytics, which often required heavy IT involvement, StyleBI empowered non-technical staff to create and customize dashboards with minimal training. This democratization of data was a game-changer, enabling editors, marketers, and sales executives to take ownership of the metrics that mattered most to their work.
Another key factor was StyleBI’s ability to deliver real-time insights. For a magazine publisher competing in the fast-paced digital world, waiting days or even hours for reports was no longer acceptable. With StyleBI, dashboards updated dynamically, allowing staff to see the immediate impact of a viral article or the effectiveness of a new ad campaign. The speed and responsiveness of StyleBI gave the company confidence to make bolder decisions without the lag associated with Pyramid.
Improvements in Reporting
The transition to StyleBI dramatically improved the company’s reporting capabilities. Advertising teams, for example, could now see not only the performance of individual campaigns but also how those campaigns aligned with reader demographics and behavior. They could demonstrate to advertisers the tangible value of placing ads with the magazine, supported by granular data. This helped secure larger, longer-term ad contracts.
Editorial staff benefited from dashboards that tracked article performance in real time. They could identify which topics and headlines resonated with readers, adjust content strategies on the fly, and ensure that premium content aligned with subscriber interests. Subscription managers, meanwhile, gained deeper insight into churn rates, renewal trends, and the impact of promotions. All of this was achieved without needing to funnel every request through a single analytics team, fostering a culture of agility and experimentation.
Executives, too, found value in StyleBI’s consolidated view of the business. They could, for the first time, see side-by-side comparisons of print versus digital revenue, cost breakdowns for editorial production, and profitability per product line. By connecting operational and financial data, StyleBI allowed leadership to make more strategic decisions about where to invest resources, whether that meant expanding digital offerings, launching new print editions, or exploring live events as a revenue stream.

Cultural and Strategic Impact
Beyond the technical improvements, the adoption of StyleBI had a cultural impact. By putting data in the hands of more employees, it fostered a sense of accountability and empowerment. Editors no longer felt they were flying blind when making content decisions; advertisers felt more confident in the value proposition; and executives could focus on long-term strategy rather than short-term problem-solving. This cultural shift aligned the entire organization around shared metrics and outcomes, creating stronger cohesion across departments that had previously operated in silos.
The strategic benefits were also significant. With more agile reporting, the company could test new business models—such as premium newsletters or micro-subscriptions—and quickly evaluate their viability. In the past, these experiments might have been hindered by slow reporting cycles. StyleBI gave the publisher the confidence to innovate without fear of being blindsided by unforeseen data trends.
Looking Ahead
The switch from Pyramid Analytics to StyleBI marked a turning point for this magazine publisher. What began as an effort to improve reporting evolved into a broader transformation of how the company approached its business. StyleBI’s integration, flexibility, and user-friendly design provided the foundation for a more data-driven culture, one that is better equipped to navigate the challenges of modern publishing. In a world where reader preferences shift rapidly and advertising dollars are fiercely contested, having the ability to act on real-time insights is not just an advantage—it is a necessity.
Ultimately, the company’s experience illustrates that business intelligence tools are not one-size-fits-all. Pyramid Analytics had served its purpose, but as the publisher grew and evolved, the need for a more adaptive and accessible solution became undeniable. By embracing StyleBI, the company positioned itself not just to survive but to thrive in the digital publishing era, proving once again that the right technology can redefine what’s possible even in industries rooted in tradition.