The Definition of Real-Time Reporting
Real-time reporting is a business intelligence practice that consists of gathering up-to-the-minute data and relaying it to users as it happens. Information is presented in its most current form for managers to easily make quick decisions when under heavy time constraints.

The Necessity of Real-Time Reporting
Prior to the digital technological era we live in today, companies had ample amount of time to assemble, process, and package business data for executives. Businesses and their competitors moved at a slow steady pace, leaving sufficient time to calculate numbers and analyze reports.
Today, with the development of high performance technologies and advanced communication channels, internal and external business affairs are moving faster than ever. Society has reached the point where annual budget cycles and monthly financial reports are no longer enough for investors. Fiscal information must now be available on-demand, at all times.
To adapt, real-time reporting software is designed to process data as quickly as it is recieved.
Real-Time Reporting Features
- Modular Design - combine elements such as tables, charts, and sub-reports to create complete reports
- Scheduling - monitor and schedule batch report generation with multiple outputs and delivery channels
- Export Formats - export reports to PDF, Excel, PowerPoint, RTF, HTML, CSV, SVG, XML, PostScript, and more
- Chart Styles - choose from more than 30 unique chart styles, including bar, pie,bar, pie, line, scatter, bubble, radar, 3D, Gantt, etc.
- Formula Tables - use formulas in a spreadsheet-like manner to present dynamic data exactly as you wish
How Has Real-time Reporting Changed Over Time?
Real-time reporting has undergone a profound transformation over the last few decades, evolving from a luxury capability reserved for large enterprises with deep pockets to a democratized and integral feature available in even modest business intelligence (BI) setups. This evolution has been driven by major advances in computing power, networking, data storage, cloud architecture, and analytics software. As businesses have grown increasingly reliant on immediate, data-driven insights, the expectations for what constitutes "real-time" have grown sharper, and the stakes higher.
In this article, we'll explore the historical trajectory of real-time reporting from its origins in mainframe-based systems to today's cloud-native, event-streaming dashboards. We'll also look at how user needs, technical infrastructure, and industry applications have shaped its development, and what the future of real-time data monitoring and reporting may hold.
The Beginnings: Batch Processing Era
In the early days of computing, data processing and reporting were fundamentally batch-oriented. Businesses would input data into punch cards or early databases, and reports would be generated on a scheduled basis—daily, weekly, or monthly. The term "real-time" had little relevance in this context. Any attempt to retrieve or process data immediately required custom software and specialized hardware.
Real-time reporting in the 1970s and 1980s was largely confined to mission-critical environments such as air traffic control systems, military defense networks, or mainframe-backed financial trading platforms. These early "real-time" systems were highly proprietary and incredibly expensive to build and maintain. Data had to be collected from sensors or terminals, routed through centralized processing units, and displayed on primitive terminals. The scope was narrow, and the data volumes were low by today's standards.
Nevertheless, this period laid the foundation for thinking differently about time-sensitive information. Organizations began to recognize the strategic advantage of not waiting until "the end of the month" to make key decisions.
Client-Server Models and the 1990s Shift
The 1990s brought significant changes in computing architecture with the rise of client-server models. Relational databases like Oracle, SQL Server, and IBM DB2 became mainstream, and reporting tools like Crystal Reports gained popularity. These tools could connect to enterprise databases and allow users to generate semi-dynamic reports with relatively minimal programming effort.
While the reporting was still largely scheduled and batch-oriented, data refresh rates began to improve. The introduction of intranets and local area networks allowed departments to share reports electronically instead of relying solely on printed formats. The concept of "near real-time" started to gain traction, especially in sectors like retail, where point-of-sale data could be aggregated and viewed within hours rather than days.
One of the most significant constraints during this era was the speed of data warehousing. Extract, Transform, Load (ETL) processes were time-consuming and resource-intensive, making true real-time analytics impractical for most companies. However, the seeds for change were sown.
The 2000s: Business Intelligence and Web Dashboards
The early 2000s marked the rise of web-based BI platforms like Tableau, Qlik, Cognos, and later Power BI. These tools popularized the dashboard as a visual paradigm for data consumption and made it possible for non-technical users to explore data in relatively interactive ways. Although most dashboards still depended on scheduled refresh cycles, the appetite for live data started to grow.
Companies began investing in middleware, APIs, and faster ETL pipelines to push more up-to-date information into data warehouses and reporting systems. Operational dashboards for logistics, call centers, and e-commerce began surfacing metrics that were only minutes old.
The term "real-time reporting" was now entering mainstream vocabulary. However, the gap between expectation and reality was still wide. Many reports branded as "real-time" were actually delayed by five, ten, or even thirty minutes. But in many industries, even this represented a quantum leap forward.
The 2010s: Big Data and the Real-Time Revolution
The 2010s were a turning point for real-time reporting, driven by two technological trends: the explosion of big data and the widespread adoption of cloud computing. Frameworks like Apache Hadoop and Spark made it feasible to process massive volumes of data in parallel. At the same time, streaming platforms like Apache Kafka, Amazon Kinesis, and Google Pub/Sub enabled event-driven architectures where data could be ingested, processed, and visualized almost instantly.
Real-time analytics moved from being a back-office function to a frontline necessity. Consider these examples:
- In e-commerce, dashboards showed real-time inventory levels, sales trends, and customer activity.
- In manufacturing, real-time reporting flagged anomalies in production lines for immediate resolution.
- In fintech, dashboards monitored fraud detection algorithms and flagged suspicious transactions in milliseconds.
- In digital marketing, campaign metrics like click-through rates, conversions, and social engagement were updated live.
Cloud-native BI platforms like Looker, Mode, and InetSoft's StyleBI took advantage of this shift by offering lightweight, API-friendly integrations with live databases and streaming data pipelines. Instead of relying solely on periodic refreshes, these platforms could subscribe to data events and update visualizations on the fly.
Today: From Real-Time to Right-Time Reporting
Today, real-time reporting is not just about speed—it's about relevance and context. Thanks to machine learning and advanced analytics, systems can now decide which data needs to be shown in real time, and which can be aggregated or delayed.
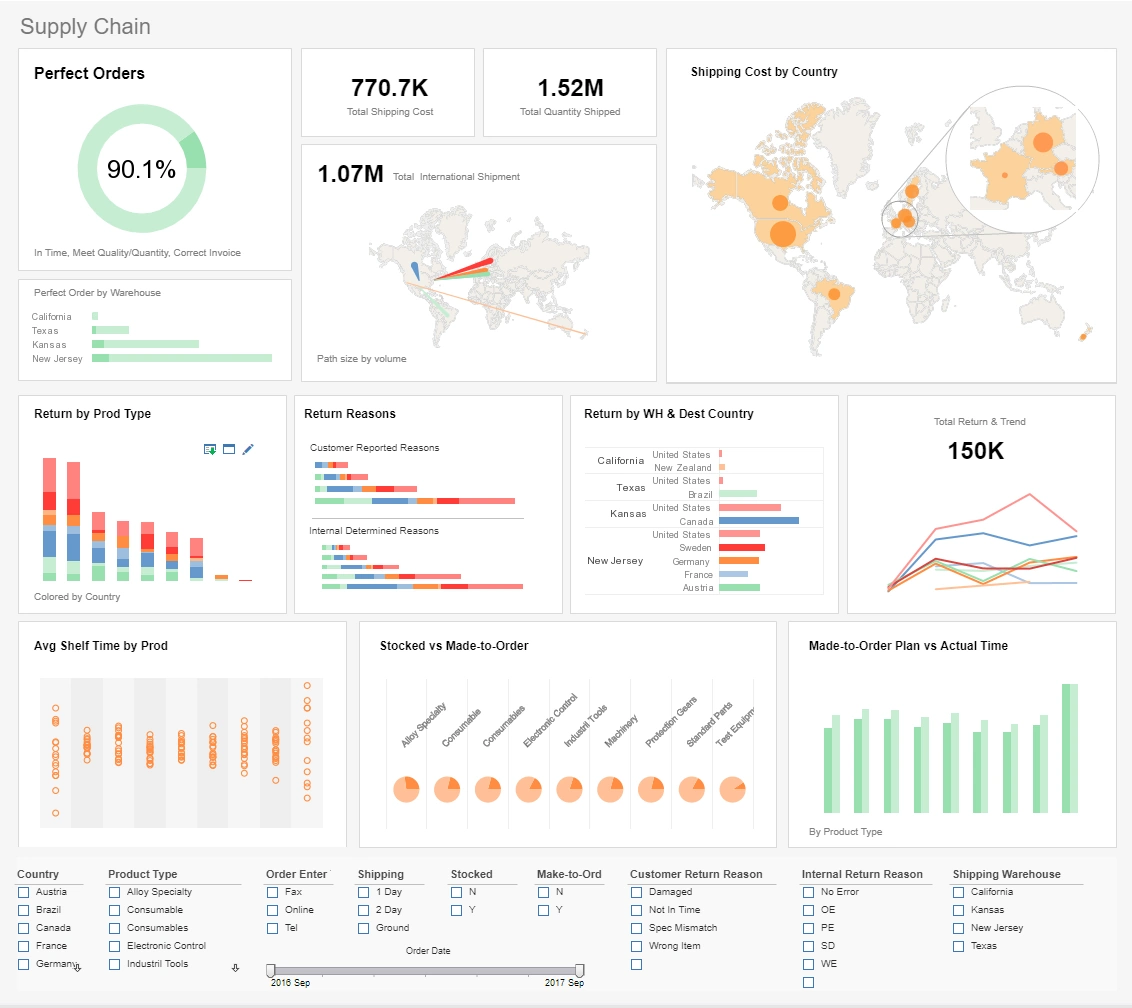
For instance, a global logistics firm might track shipping routes and warehouse inventories in real time, but summarize employee performance metrics on a weekly basis. Retailers use real-time pricing analytics only during flash sales or high-traffic periods. This notion of "right-time reporting" reflects a mature understanding of operational needs and user experience.
In modern architectures, real-time reporting is powered by:
- Data Lakes and Warehouses (like Snowflake and BigQuery)
- Streaming Frameworks (like Kafka Streams, Apache Flink)
- Serverless Functions (e.g., AWS Lambda for reactive processing)
- Embedded Dashboards (like those powered by InetSoft StyleBI)
- In-memory Analytics (such as Qlik or SAP HANA)
These technologies ensure data is not only updated quickly but also contextualized, curated, and presented in intuitive interfaces. Real-time alerts, anomaly detection, natural language queries, and AI-generated insights are now common dashboard features.
The User Experience Shift
As the technology has advanced, so have user expectations. It's no longer sufficient to offer a dashboard that refreshes every few minutes. Users now expect:
- Interactive Drilldowns that refresh instantly
- Mobile Access to real-time dashboards
- Self-Service Configurability for setting alerts and thresholds
- Integrated Notifications via Slack, email, or SMS
- Visualization Personalization for different roles and permissions
The combination of real-time data with customizable UI/UX has made analytics more actionable than ever before. Users can go from insight to decision without waiting for a weekly report or consulting a data analyst.
The Future: Edge, AI, and Ambient Intelligence
Looking ahead, real-time reporting will become even more embedded in operational environments through edge computing and AI. In industries like oil & gas, mining, healthcare, and logistics, devices at the edge of networks will perform real-time analysis and sync with central systems only when necessary.
AI will play a larger role in shaping what real-time data is surfaced, to whom, and in what format. Context-aware systems might tailor visualizations based on user behavior, job function, or geographic location. Dashboards may evolve into "ambient data assistants"—tools that proactively inform users of changes or decisions needed, without the need to check metrics manually.
Moreover, regulatory and compliance pressures will force industries to maintain immutable audit trails for real-time data—ensuring transparency and accountability even at high speeds.
