Tableau vs. InetSoft: Whose BI is Better?
Deciding whether or not Tableau is a suitable business intelligence product to help serve your enterprise?
Consider InetSoft's easy, agile and robust BI solution, StyleBI. InetSoft's BI application benefits business-end users with superior capabilities and more flexibility than what Tableau has to offer.
While Tableau's designer can only be run on Windows, StyleBI is a Java-based server application that can be deployed with unrestricted functionality on Windows, Linux, and Mac OS. It is a zero-client program on a web-based platform that can be accessed from any web browser and mobile device. This is a huge advantage over Tableau, which requires a desktop plugin to perform basic visual analytics.
InetSoft recognizes the inconvenience and dilemmas that arise from requiring IT intervention to integrate new data sources. InetSoft enables maximum self-service by providing an easy to use data mashup tool. Users of StyleBI can create their own data mashups, and even include data from their own spreadsheets. The interface is intuitively easy to navigate, requiring only Excel-level skills.
Upgraded Visualization and Impressive Reports
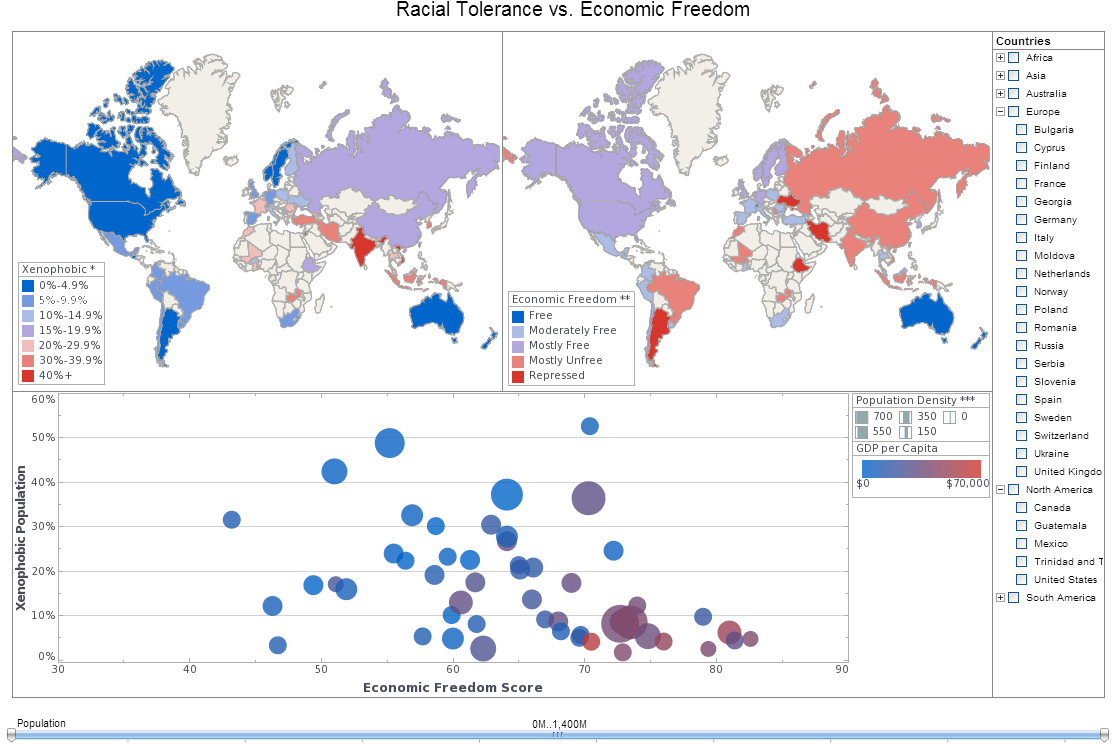
Generating visualizations is the most prominent feature of Tableau's BI software. However, not only does InetSoft empower users with prevailing capabilities for visualizations, StyleBI also enables enterprises to create detailed and professional quality reports.
Data analysis and exploration are unbounded with the implementation of StyleBI. It allows multiple objects per sheet with multiple sheets per dashboard container. Users can customize multi-dimensional dashboards and interact with their business data to reveal advantageous insights.
Composing pixel-perfect, paginated reports is also included with the BI software application. To keep the enterprise updated with crucial information, the reporting engine quickly converts reports in a publishable format for easy distribution and informative presentation.
Brilliant Data Mashup
Get the most out of your business data with InetSoft's enterprise data mashup engine. Tableau's data blending service falls short in comparison to the robustness of StyleBI's user-defined unique data mashups.
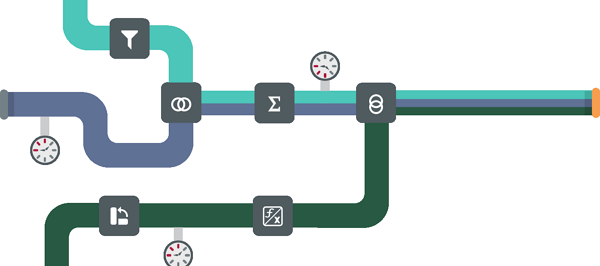
Using a drag-and-drop interface, the data mashup engine will automatically write historic and real-time queries that integrate and manipulate massive amounts of data. The patent pending Data Block technology is used to combine diversified fields and tables into a single relevant data model.
The powerful data mashup engine simultaneously extracts data from virtually any data source and merges it along common dimensions, so that a cluster of sources can be analyzed and handled within a single view. It is versatile enough to handle numerous data elements, which enables better data exploration for faster solutions to business problems.
Tableau vs Six Lesser-Known Competitors (including StyleBI)
Tableau is the heavyweight everyone thinks of when it comes to visual analytics: powerful, polished, and widely adopted. But many organizations — especially those with tighter budgets, different technical priorities, or unique embedding needs — find better fits among less-heralded platforms. Below I compare Tableau to six such competitors: StyleBI (InetSoft Style Intelligence), Metabase, Apache Superset, Yellowfin, Dundas BI, and Grow. I’ll cover who each one is best for, where they shine, and where Tableau typically retains the edge. This is a pragmatic, opinionated look designed to help you match real needs to real tradeoffs.
Quick framing: Tableau’s strengths and weaknesses
Tableau’s strengths are mature visualization capabilities, a huge ecosystem (training, consultants, extensions), and enterprise-grade governance options. It’s fast for building interactive dashboards and scaling visuals across many users. Its weaknesses are price (especially at scale), the learning curve for advanced analytics, and sometimes heavier infrastructure needs for high-refresh or very large datasets. For organizations that need the broadest feature set and ecosystem, Tableau often wins. For those optimizing for cost, simplicity, embeddability, or specific workflow integrations, the alternatives can be compelling.
1. StyleBI (InetSoft Style Intelligence)
Who it’s for: Small-to-midsize businesses and embedded analytics teams that want a lower-cost, flexible platform with strong mashup and embedding features.
Strengths: StyleBI tends to have a lower entry price and offers both perpetual and subscription licensing options. It’s built around ease of embedding analytics into applications, supports mashups of diverse data sources, and favors pixel-perfect reporting alongside interactive dashboards. For teams that need practical, fast implementations without the full enterprise overhead, it’s a sensible choice.
Weaknesses vs Tableau: Visualizations and advanced analytic features aren’t as extensive or as polished; fewer third-party integrations and a smaller partner ecosystem. For very large deployments or teams that demand Tableau’s breadth of visual sophistication, StyleBI can feel lean.
2. Metabase
Who it’s for: Startups and small teams that want open-source simplicity, quick answers, and minimal ops overhead.
Strengths: Metabase’s big selling points are ease of setup and a user-friendly question-and-answer interface that non-technical users love. It’s open source, which makes it inexpensive to pilot and highly customizable for teams that can manage basic ops. For fast ad-hoc querying and simple dashboards, Metabase is extremely effective.
Weaknesses vs Tableau: Metabase lacks advanced visual polish, sophisticated analytics, and enterprise governance. Scaling to hundreds or thousands of users while maintaining security and performance requires engineering investment; if your needs move beyond simple dashboards, Metabase can become limiting.
3. Apache Superset
Who it’s for: Data-savvy teams and engineering-led organizations that want an open-source, scalable BI platform and are willing to manage infrastructure.
Strengths: Superset scales well, supports complex SQL-based exploration, and integrates into data-platform-heavy stacks. It’s highly extensible and has a strong developer community. For organizations that already run modern data warehouses and prioritize open-source flexibility, Superset is a strong fit.
Weaknesses vs Tableau: Superset is less polished for end-user self-service and requires more engineering to make broadly usable. Visualizations are improving but still lag Tableau’s curated UX, and governance/user onboarding demands more customization.
4. Yellowfin
Who it’s for: Businesses that want an integrated analytics platform with storyline-driven BI and embedded analytics options.
Strengths: Yellowfin differentiates on narrative BI (data storytelling), integrated dashboards, and embedded analytics capabilities. It often bundles practical features like scheduling, automated insights, and collaboration tools in a way that’s friendly to operational teams. Pricing is typically more approachable than top-tier enterprise tools.
Weaknesses vs Tableau: Visual expressiveness and the developer/consultant ecosystem are smaller; some advanced analytics capabilities aren’t as mature. Organizations that need bleeding-edge visualization or a large partner network may prefer Tableau.
5. Dundas BI
Who it’s for: Organizations that value highly customizable dashboards, enterprise infusion, and pixel-perfect layout control.
Strengths: Dundas offers an extremely flexible canvas for building tailored visualizations and reports. It’s strong where bespoke dashboards or embedded analytic experiences must mirror brand and UX precisely. The platform supports both operational and ad-hoc analytics, and it’s designed to be embedded into other applications.
Weaknesses vs Tableau: Dundas’s flexibility can be a double-edged sword — implementation complexity and development time often increase. For teams that prefer rapid, out-of-the-box dashboarding, Tableau is faster. Dundas also has fewer off-the-shelf community resources.
6. Grow
Who it’s for: Small-to-medium businesses focused on growth metrics and executive-friendly KPI dashboards with simple integration and fast time-to-value.
Strengths: Grow emphasizes simple onboarding, prebuilt connectors to SaaS tools, and easy dashboard sharing — ideal for marketing, sales, and ops teams that want to visualize metrics without heavy IT involvement. It’s marketed for speed and clarity rather than deep analysis.
Weaknesses vs Tableau: Not meant for complex, exploratory analytics; limited advanced visualization and transformation capabilities. Grow trades depth for simplicity, so heavy data-science teams will find it insufficient.
Comparative takeaways
- Cost & TCO: Most of these alternatives cost less upfront than Tableau and can deliver lower TCO for small-to-mid deployments. But lower license fees sometimes shift costs into implementation or engineering (especially for open-source options).
- Ease of use: Metabase and Grow prioritize simplicity; StyleBI and Yellowfin strike a middle ground; Superset and Dundas lean toward customizability and engineering control.
- Scale & governance: Tableau typically still leads for enterprise governance, large-scale deployment, and ecosystem support. Superset and Dundas can scale, but expect heavier in-house support to achieve the same maturity level.
- Embedding & OEM: StyleBI and Dundas are strong when you need embedded analytics in your product; Yellowfin and Grow also offer embedding at different complexity levels. Tableau does embedding well but at a higher cost and with enterprise licensing complexity.
- Analytics depth: For true exploratory analytics and polished visuals, Tableau is hard to beat. For operational dashboards, guided insights, or low-cost ad-hoc reporting, the competitors can often deliver faster ROI.


