InetSoft Webinar: Visualization Techniques for Business Applications
This is the continuation of the transcript of a Webinar hosted by InetSoft on the topic of "What are the Benefits of a Visual Reporting Solution?" The speaker is Abhishek Gupta, product manager at InetSoft.
Here is another question. Other than sales what other kind of business applications could you use that kind of visualization technique for?
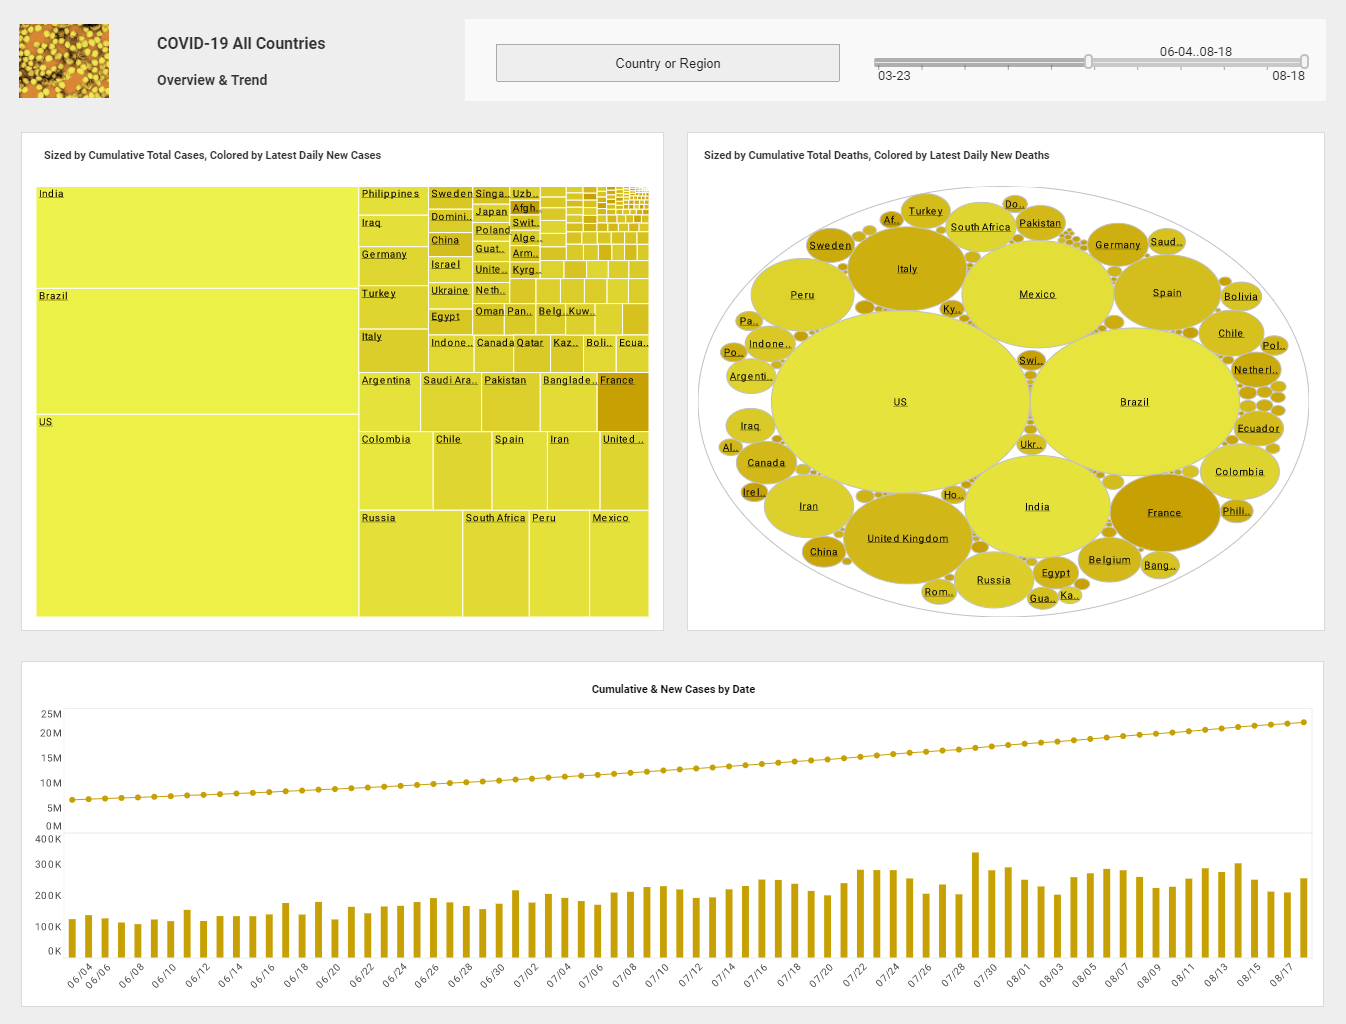
If we go back to this visualization, these kinds of problems occur in a variety of industries. We could give examples in health care where we’re doing a bunch of work on claims analysis outlier detection. We’re also doing a lot of work in clinical and financial analysis.
In medical radiation oncology claims the issue there is you get a lot of data. One example is wait times,
what is driving higher wait times.
Another what would be referrals analysis on physician revenue.
Who is bringing in the most referring revenue and which types of patients are they? And we’re doing work
in financial services and retail banking on promotions and customer loyalty.
We’re doing a bunch of work in human resources looking at teams of people and workforce skills and pay versus performance. Those kinds of things would be combinations of portfolio analysis and outlier detection. I could keep going, but I think that this kind of technology fits into all of these kinds of problems. These problems are generally departmental level. While an enterprise might doesn’t do this type of visual analysis, usually it’s the department that has the specific problem to solve.
| #1 Ranking: Read how InetSoft was rated #1 for user adoption in G2's user survey-based index | Read More |
Within an enterprise, senior management may know it has an issue with medical claims, and this kind of
approach would be great for that. Then you go into a university fundraising and there are a series of problems
that this fits into. One of them we demonstrated today.
So that’s how I would answer the questions. If you have more specific situation, that would be great to discuss, and I think that the key point here is the reporting analysis is departmental oriented discovering analysis, and it solves all of these kinds of problems.
Great, we actually have a hand raised, Nikki.
Nikki: Hello, can you hear me? My question is how do you connect with the data system. In the demos you showed us the data was already connected to. Can you talk about this process?
StyleBI has connectors the load data from sources like, Excel, Oracle, SQL Server, saleforce.com, ODBC, Microsoft Access, text files, tab delimited and several proprietary enterprise application and OLAP servers. We also have an API for creating custom connectors and connecting to Web services.
The first step for any database is for an IT person who understands it to add it or several as connections. We have a data modeler tool to set up the logical business layer and relationships among the tables if there are many. From there the next step is to create a worksheet selecting the fields of interest, mashing up across data sources, if applicable.
 |
View live interactive examples in InetSoft's dashboard and visualization gallery. |
The data can be loaded on demand from wherever it came from, and it can be multiple sources. In some cases we might load 10 tables from an Oracle Database, six tables from an SQL Server Database plus some Excel Sheets. The tool will bring them all into memory, and then we have formulas for calculating metrics once the data is in.
So another form of data access is via our data grid cache which actually caches or embeds the data. So any dashboard or analysis running on it would not update when somebody opens it. It would be a snapshot, and it would not hit the database again. And in production we typically do this when analysis doesn’t need to be real-time.
There’s a scheduler. Usually it’s once a day. It could be six times a day. It could be once a week. The timer would kick off the cache update at let’s say 3:00 in the morning, and it does load the data from the different sources and then save it as a cache on a file server. Then for anyone opening up a dashboard or analysis, it just opens up and brings all the data in the memory and loads the project.
Size wise we put it as much data in RAM as will fit and rely on disk access for the rest. It could be a four gigabyte data load. For instance, a dataset might have a million customers, seven million transactions, and 45 tables. That probably totals 30 or 40 million rows, and it fits in about four gigs in RAM.
We’ve got some customers that are larger running this on servers, 16, eight gig servers. You can actually scale up with multiple machines in a cluster. These large Oracle or SQL Server database loads with tens of millions of records, and it could be four gigs could be eight gigs, something like that. If it's an entire data warehouse with a trillion transaction records, we can execute a SQL command on the load. It might be roll up, so it wouldn't be at the transactional level. We might roll up to the hour or the day level or something to collapse the data.
| Previous: Sales Team Reporting |


