Supply Chain Management KPI Dashboard
Help your organization run more efficiently with a supply chain management kpi dashboard created using InetSoft's StyleBI. Effective supply chain management involves tracking shipments containing large amounts of goods and supplies from varied sources, as they travel across large distances.
With InetSoft you can monitor all this information at a glance with an interactive dashboard that can be used on all devices. To receive a live custom demo for your organization click the orange button below to register.
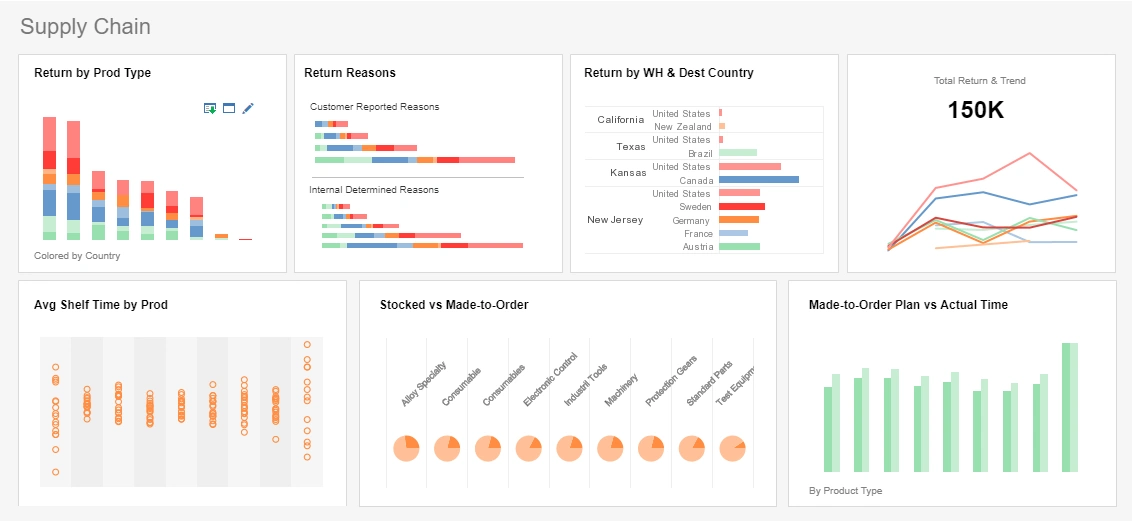
The model dashboard to the right provided tracks many key performance indicators at the global level, all in a highly visual and comprehensive manner. The boxes on the right portion of this display are a filter which would provide the live dashboard with interactivity and drilldown capability.
InetSoft's StyleBI offers a variety of chart and display types, enabling you to employ unique visual styles to display information in a compact manner which communicates actionable insights.

By selecting countries or modifying the date via a slider, users can instantaneously update the dashboard to display information relevant to specific interests and business questions. Since there are no limits or restraints on what kind of reports and visualizations can be built with the tool, users can use it to track any metrics which are important for running a successful business, including tools, errors, workers, production time, and products, all in one easy to view display if desired.

Supply Chain Key Performance Indicators
- Cash Cycle Time
- Inventory
- Average Fill Rate
- Value added
- Monthly Sales
- Business Impact Analysis
- Freight Cost
- Shipping Rate
What Would a Home Improvement Store Display on a KPI Dashboard?
- Sales Performance:
- Total Sales
- Sales by Department (e.g., lumber, tools, paint)
- Sales by Product Category
- Average Transaction Value
- Sales Growth Percentage
- Inventory Management:
- Inventory Turnover Rate
- Stockouts and Backorders
- Inventory Levels by Category
- Slow-Moving or Obsolete Inventory
- Reorder Point Attainment
- Customer Engagement:
- Customer Foot Traffic
- Conversion Rate (Percentage of visitors making a purchase)
- Customer Satisfaction Scores
- Return Customer Rate
- Average Customer Wait Time
- Marketing Effectiveness:
- ROI on Marketing Campaigns
- Click-Through Rates for Online Promotions
- Effectiveness of In-Store Promotions
- Customer Acquisition Cost
- Employee Performance:
- Sales per Employee
- Employee Productivity
- Customer Service Ratings
- Training Completion Rates
- Supply Chain and Vendor Management:
- On-Time Delivery from Suppliers
- Vendor Performance Ratings
- Lead Time for Replenishment
- Supplier Compliance Metrics
- Store Operations:
- Operating Costs
- Shrinkage Rate (inventory loss due to theft or damage)
- Store Cleanliness and Maintenance Scores
- Energy Consumption
- Online Sales and Presence:
- Website Traffic
- Online Sales Revenue
- Conversion Rates for Online Sales
- Customer Reviews and Ratings
- Product Performance:
- Best-Selling Products
- Product Return Rates
- Product Shelf Life Metrics
- Product Margins and Profitability
- Competitive Analysis:
- Market Share
- Price Comparison with Competitors
- Customer Reviews vs. Competitors
- New Product Offerings Compared to Competitors
- Health and Safety:
- Incident Rates
- Compliance with Safety Protocols
- Employee Training on Safety Procedures
- Sustainability Metrics:
- Energy Efficiency Ratings
- Waste Reduction Initiatives
- Sustainable Product Sales
- Financial Performance:
- Gross Margin
- Net Profit Margin
- Return on Investment (ROI)
- Cash Flow
- Customer Demographics:
- Customer Segmentation Data
- Geographic Customer Distribution
- Popular Purchase Categories by Customer Segment
- Operational Efficiency:
- Checkout Queue Length and Speed
- Time to Restock Shelves
- Employee Attendance and Punctuality
- Technology Adoption:
- Point-of-Sale System Uptime
- Adoption Rates of New Technologies (e.g., mobile apps, online ordering)
- Real Estate and Expansion:
- Performance of New Store Openings
- Return on Investment for Store Renovations
- Expansion Feasibility Metrics
- Community Engagement:
- Sponsorship and Community Event Participation
- Customer Participation in Loyalty Programs
- Social Responsibility Metrics

About InetSoft
Since 1996 InetSoft has been delivering easy, agile, and robust business intelligence software that makes it possible for organizations and solution providers of all sizes to deploy or embed full-featured business intelligence solutions. Application highlights include visually-compelling and interactive dashboards that ensure greater end-user adoption plus pixel-perfect report generation, scheduling, and bursting. InetSoft's patent pending Data Block™ technology enables productive reuse of queries and a unique capability for end-user defined data mashup.
This capability combined with efficient information access enabled by InetSoft's visual analysis technologies allows maximum self-service that benefits the average business user, the IT administrator, and the developer. InetSoft was rated #1 in Butler Analytics Business Analytics Yearbook, and InetSoft's BI solutions have been deployed at over 5,000 organizations worldwide, including 25% of Fortune 500 companies, spanning all types of industries.

More Articles About KPIs
Analytics in the Gaming Industry - As you now understand, analytics data can be collated on a vast amount of things. Yet, interpreting the information into workable ideas is the final step in using this tool to improve your business. The ways in which casino managers can use this data are endless. You just need to have a little business-related imagination. Some of the most common include...
Balanced Scorecards for Non-profit Organizations - Non-profit organizations, such as charities, foundations, and NGOs, often use balanced scorecards to assess their effectiveness in achieving their mission and meeting the needs of their stakeholders. This helps them monitor their performance in areas like fundraising, program delivery, and social impact...
Data Visualization Projects With Professional Services - So it comes together quickly, and we'll deliver these data visualization projects with professional services to get a first project running. For example, you saw several of them and then usually the client can modify it or bring up other projects. Maybe you did the call center one for the annual fund and higher education first. Okay now let's work in leadership...
Evaluate InetSoft's Zendesk Sell Dashboard Application - Looking for a good solution for Zendesk Sell dashboard reporting? InetSoft's pioneering BI application produces great-looking dashboards that give you more self-service analytic capabilities. View a demo and try interactive examples...
JavaScript Report Data Access - Another asset that sets InetSoft's JavaScript Reporting Framework apart from the rest is the easy access to almost any open database format-specifically any relational database via Java database connectivity (JDBC), multidimensional databases, XML, SOAP, Java beans (POJO), enterprise Java beans (EJB), flat files, and cloud sources...

Stakeholder Reach and Impressions - The first step in stakeholder involvement is reach. A baseline for evaluating the initial effect is established by counting the people who have been exposed to the organization's messaging, information, or events. Impressions provide a more precise estimate of the audience's potential size that has seen or engaged with the organization's activity. These metrics provide...