Product Information: Aggregating Dashboard Data
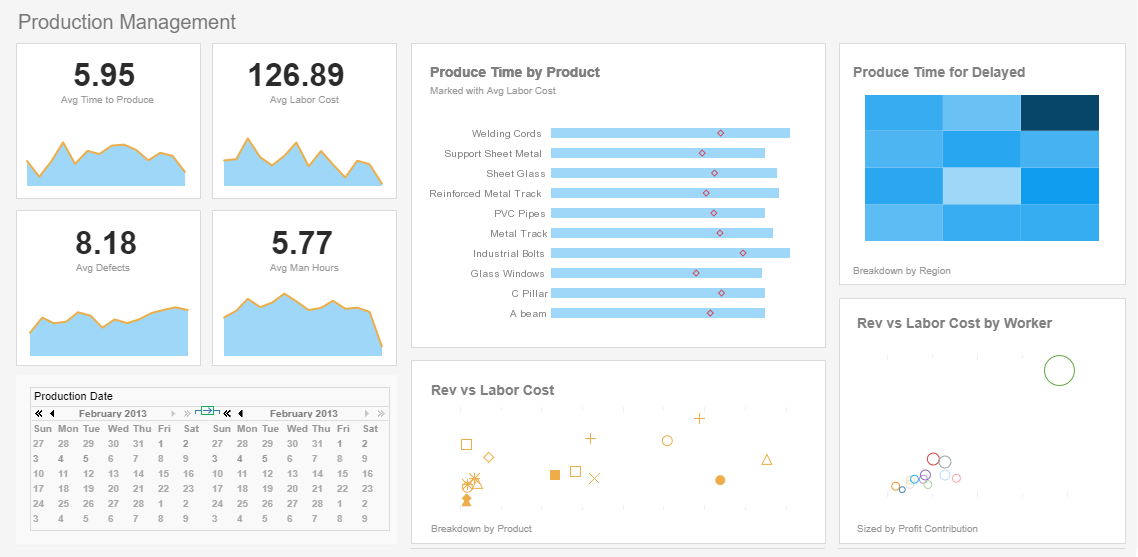
Users can easily aggregate data and create comprehensive reports from different data sources using InetSoft's award-winning dashboard software. View the example below to learn more about the Style Intelligence solution.
To define grouping and data aggregation columns (summary columns) for a Data table, follow these steps:
- Right-click the table's title row and select 'Group and Aggregate'. This opens the 'Aggregate' dialog box.
- Select the grouping columns by clicking the 'Group' check box next to one or more column names.
- When you enable grouping for a column, by default each distinct value in the column defines its own group. Aggregation is then based on these groups. For example, if you group a column of state names, each distinct state name will define its own group, and aggregate values will be computed for each of those groups.
| #1 Ranking: Read how InetSoft was rated #1 for user adoption in G2's user survey-based index | Read More |
- (Optional) If a user-defined group matches the grouping column data format (String, Double, etc.), you can select the user-defined group from the right-side menu.
- User-defined groups give you greater flexibility in partitioning the entries in a column for grouping. If you select a user-defined grouping from the menu, aggregations will be based on that user-defined grouping.
- (Optional) If you specify grouping for a column that has a Date format, you can select a predefined or user-defined Date grouping (Year, Quarter, etc.) from the right-side menu.
- The actual date values in the grouping column will be replaced with the new group labels, e.g., '1st Quarter', 'January', etc.
- Click the 'Aggregate' check box for columns containing the measures that you wish to aggregate (summarize).
- For the aggregate columns, choose the method of aggregation (Sum, Correlation, etc.).
- (Optional) For the univariate aggregation methods (Sum, Max, etc.), select the 'Percentage' check box to display the aggregated measure as a percentage of the grand total.
- (Optional) For the bivariate aggregation methods (Correlation, etc.), select the second operand (column) for the computation from the 'with' menu.
- Click 'OK' to close the 'Aggregate' dialog box.
 |
View live interactive examples in InetSoft's dashboard and visualization gallery. |
The table is now grouped. Only the table columns that are either grouping columns or aggregate columns are shown in the grouped table. All other columns are hidden. In the grouped table, each column has an icon indicating whether it is a grouping column or an aggregate column. Click any of these icons to reopen the 'Aggregate' dialog box.
What Data Is Mashed Up in Immunology Research?
In immunology research, data from various sources and of diverse types are integrated (or "mashed up") to provide comprehensive insights into the immune system and its responses. The integration of these data types helps in understanding complex biological processes, identifying disease mechanisms, and developing new therapies. Here are the key types of data that are typically mashed up in immunology research:
- Genomic Data:
- Description: Information about DNA sequences, including genetic variants and mutations.
- Sources: Whole genome sequencing, exome sequencing, single nucleotide polymorphism (SNP) arrays.
- Transcriptomic Data:
- Description: Data on RNA expression levels, indicating which genes are active in different cells or conditions.
- Sources: RNA sequencing (RNA-seq), microarrays.
- Proteomic Data:
- Description: Information about protein expression and modifications.
- Sources: Mass spectrometry, protein arrays.
- Metabolomic Data:
- Description: Data on small molecules and metabolites within cells.
- Sources: Mass spectrometry, nuclear magnetic resonance (NMR) spectroscopy.
- Clinical Data:
- Description: Patient health records, including diagnoses, treatments, and outcomes.
- Sources: Electronic health records (EHRs), clinical trial databases.
- Immune Profiling Data:
- Description: Detailed information about the immune cell populations and their states.
- Sources: Flow cytometry, CyTOF (cytometry by time-of-flight), single-cell RNA-seq.
- Cytokine and Chemokine Data:
- Description: Levels of cytokines and chemokines, which are signaling molecules in the immune system.
- Sources: ELISA (enzyme-linked immunosorbent assay), multiplex assays.
- Microbiome Data:
- Description: Information about the microbial communities in and on the human body.
- Sources: 16S rRNA sequencing, metagenomics.
- Epigenomic Data:
- Description: Information about DNA methylation, histone modifications, and other epigenetic changes.
- Sources: ChIP-seq (chromatin immunoprecipitation sequencing), bisulfite sequencing.
- Functional Assay Data:
- Description: Results from experiments testing the function of immune cells or molecules.
- Sources: In vitro and in vivo assays, functional genomics screens.
- Environmental and Lifestyle Data:
- Description: Information about patients' environments and behaviors that could impact immune responses.
- Sources: Surveys, wearable devices, environmental monitoring.
- Pathogen Data:
- Description: Information about the pathogens involved in infections, including their genomes and interactions with the host immune system.
- Sources: Pathogen sequencing, pathogen-host interaction studies.
- Structural Biology Data:
- Description: Three-dimensional structures of immune molecules and complexes.
- Sources: X-ray crystallography, cryo-electron microscopy, NMR spectroscopy.
- Pharmacogenomic Data:
- Description: Data on how genetic differences influence responses to drugs.
- Sources: Genotyping, drug response studies.
- Bioinformatics and Computational Data:
- Description: Computational models and simulations of immune processes.
- Sources: In silico experiments, databases of immune interactions and pathways.
- Patient Demographic Data:
- Description: Information about patients' age, sex, ethnicity, and other demographic factors.
- Sources: Patient records, research questionnaires.
- Histopathological Data:
- Description: Microscopic examination of tissues to study disease pathology.
- Sources: Tissue biopsies, imaging studies (e.g., immunohistochemistry).
- Vaccine Response Data:
- Description: Data on immune responses to vaccines.
- Sources: Clinical trials, immunogenicity studies.
- Allergen Data:
- Description: Information on allergens and their impact on the immune system.
- Sources: Allergen databases, allergy testing.
- Longitudinal Cohort Data:
- Description: Data from studies tracking the same individuals over time to study immune system changes and disease progression.
- Sources: Longitudinal cohort studies, biobanks.
| Previous: Subquery Dashboard Options |
Next: Dashboard Crosstab Table
|


