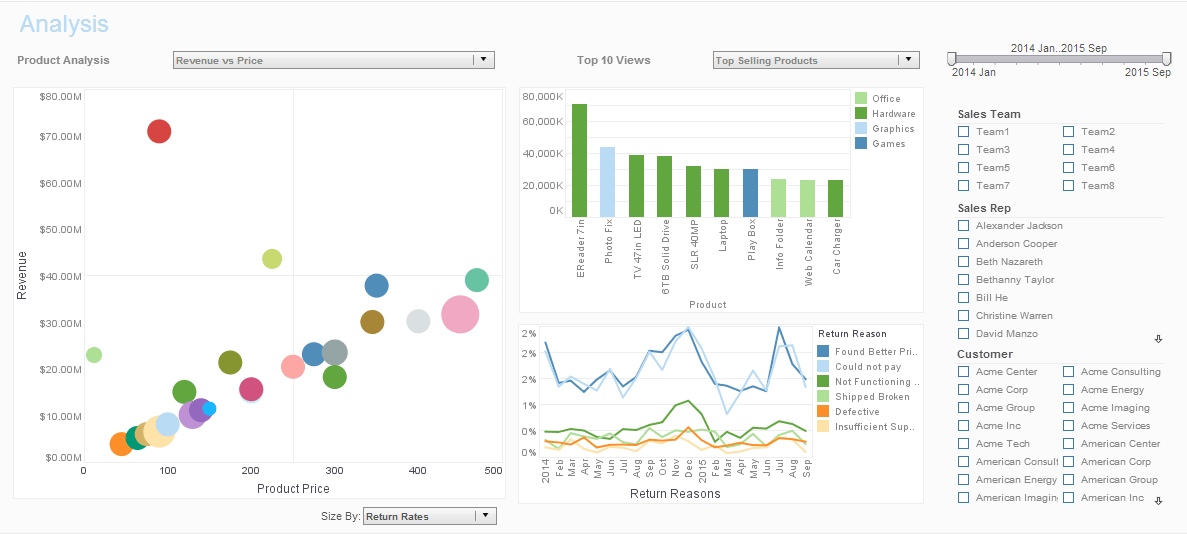
InetSoft Product Information: Chart Generator Tool
Looking for a chart generator tool? Since 1996, InetSoft has been providing developers free and commercial reporting and charting tools. View a demo and try them for free.
Style Intelligence is a commercial business intelligence software package with Web-based chart generation, reporting, and real-time access to almost any data source.
 |
View a 2-minute demo of InetSoft's easy, agile, and robust BI software. |
StaticLineFrame
The StaticLineFrame object contains a line frame defined by explicit line data in the VisualFrame.setField(field) column, or by the fixed line in StaticLineFrame.setLine(value) / StaticLineFrame.line. To create a StaticLineFrame object, call the StaticLineFrame constructor.
importPackage(inetsoft.graph.aesthetic);
var frame = new StaticLineFrame(GLine.LARGE_DASH);
You can pass a GLine object or a field name (e.g., 'Line') to the constructor, or specify this later using the StaticLineFrame.setLine(value) / StaticLineFrame.line or inherited VisualFrame.setField(field) property.
Example (Report)
Bind a line-type chart to the sample 'All Sales' query, with 'Company' (top 5) on the X-axis, and Sum(Total) on the Y-axis. Add the following script in the onLoad Handler.
importPackage(inetsoft.graph.aesthetic);
Graph1.bindingInfo.setShapeField("Company",Chart.NUMBER)
Graph1.bindingInfo.lineFrame = new StaticLineFrame;
Graph1.bindingInfo.lineFrame.line = GLine.LARGE_DASH;
Example (Report or Viewsheet)
Bind a point-type chart to the sample 'All Sales' query, with 'Company' (top 5) on the X-axis, and Sum(Total) on the Y-axis. Add the following script in the onLoad Handler.
importPackage(inetsoft.graph)
importPackage(inetsoft.graph.element)
importPackage(inetsoft.graph.scale)
importPackage(inetsoft.graph.aesthetic)
importPackage(inetsoft.graph.data)

var arr = [["State","Quantity","Line"],
           ["NJ",200,GraphConstants.THICK_LINE],
           ["NY",300,GraphConstants.MEDIUM_DASH]];
dataset = new DefaultDataSet(arr);
graph = new EGraph();
var elem = new PointElement("State", "Quantity");
var sizeframe = new StaticSizeFrame(9);
var lineframe = new StaticLineFrame();
lineframe.setField("Line");
elem.setLineFrame(lineframe);
elem.setSizeFrame(sizeframe);
graph.addElement(elem);
StaticLineFrame.setLine(value) / StaticLineFrame.line
Specifies the static line style for graphical elements. If the data in the column assigned to the inherited VisualFrame.setField(field) property are GLine objects, these data values are used instead of StaticLineFrame.line.
Parameter/Type
value
  GLine or
  GraphConstants.NO_BORDER  // Empty border
Example (Report)
Bind a line-type chart to the sample 'All Sales' query, with 'Company' (top 5) on the X-axis, and Sum(Total) on the Y-axis. Add the following script in the onLoad Handler.
importPackage(inetsoft.graph.aesthetic);
Graph1.bindingInfo.setShapeField("Company",Chart.NUMBER)
Graph1.bindingInfo.lineFrame = new StaticLineFrame;
Graph1.bindingInfo.lineFrame.line = GLine.LARGE_DASH;
Example (Report or Viewsheet)
importPackage(inetsoft.graph)
importPackage(inetsoft.graph.element)
importPackage(inetsoft.graph.scale)
importPackage(inetsoft.graph.aesthetic)
importPackage(inetsoft.graph.data)

var arr = [["State", "Quantity"], ["NJ", 300], ["NY", 200]];
dataset = new DefaultDataSet(arr);
graph = new EGraph();
var elem = new PointElement("State", "Quantity")
var frame = new StaticLineFrame();
frame.setLine(GLine.DOT_LINE);
elem.setLineFrame(frame);
graph.addElement(elem);
LinearLineFrame
The LinearLineFrame object contains a continuous line frame that returns varying line styles. To create a LinearLineFrame object, call the LinearLineFrame constructor.
 importPackage(inetsoft.graph.aesthetic);
 var frame = new LinearLineFrame('Quantity');
You can pass the name of a field (e.g., 'Quantity') to the constructor, or specify this later using the inherited VisualFrame.setField(field) property.
Example (Report or Viewsheet)
Bind a line-type chart to the sample 'All Sales' query, with 'Company' (top 5) on the X-axis, and Sum(Total) on the Y-axis. Add the following script in the onLoad Handler.
importPackage(inetsoft.graph.aesthetic);
Graph1.bindingInfo.setShapeField("Total",Chart.NUMBER);
Graph1.bindingInfo.lineFrame = new LinearLineFrame;
Example (Report or Viewsheet)
importPackage(inetsoft.graph)
importPackage(inetsoft.graph.element)
importPackage(inetsoft.graph.scale)
importPackage(inetsoft.graph.aesthetic)
importPackage(inetsoft.graph.data)

var arr = [["State", "Quantity","Total"], ["NJ",300,1000],
           ["NY",200,1500]];
dataset = new DefaultDataSet(arr);
graph = new EGraph();
var elem = new PointElement("State", "Quantity")
var lframe = new LinearLineFrame();
var sframe = new StaticSizeFrame();
lframe.setField("Total");
sframe.setSize(10);
elem.setLineFrame(lframe);
elem.setSizeFrame(sframe);
graph.addElement(elem);
CategoricalLineFrame
The CategoricalLineFrame object contains a unique line style for each discrete value. To create a CategoricalLineFrame object, call the CategoricalLineFrame constructor.
 importPackage(inetsoft.graph.aesthetic);
 var frame = new CategoricalLineFrame('Quantity');
You can pass the name of a field (e.g., 'Quantity') to the constructor, or specify this later using the inherited VisualFrame.setField(field) property.
Example (Report)
Bind a line-type chart to the sample 'All Sales' query, with 'Company' (top 5) on the X-axis, and Sum(Total) on the Y-axis. Add the following script in the onLoad Handler.
importPackage(inetsoft.graph.aesthetic);
Graph1.bindingInfo.setShapeField("Employee",Chart.STRING);
Graph1.bindingInfo.lineFrame = new CategoricalLineFrame;
Graph1.bindingInfo.lineFrame.setLine('Robert',
   GLine.LARGE_DASH);
Graph1.bindingInfo.lineFrame.setLine('Eric',
   GLine.LARGE_DASH);
Graph1.bindingInfo.lineFrame.setLine('Sue',GLine.DOT_LINE);
Graph1.bindingInfo.lineFrame.setLine('Annie',
   GLine.DOT_LINE);
Example (Report or Viewsheet)
importPackage(inetsoft.graph)
importPackage(inetsoft.graph.element)
importPackage(inetsoft.graph.scale)
importPackage(inetsoft.graph.aesthetic)
importPackage(inetsoft.graph.data)

var arr = [["State", "Quantity"],
           ["NJ",300],["NY",200],["PA",100]];
dataset = new DefaultDataSet(arr);
graph = new EGraph();
var elem = new IntervalElement("State", "Quantity")
var frame = new CategoricalLineFrame();
frame.setField("State");
elem.setLineFrame(frame);
graph.addElement(elem);
 |
Read the top 10 reasons for selecting InetSoft as your BI partner. |
| Previous: Chart Generator |
