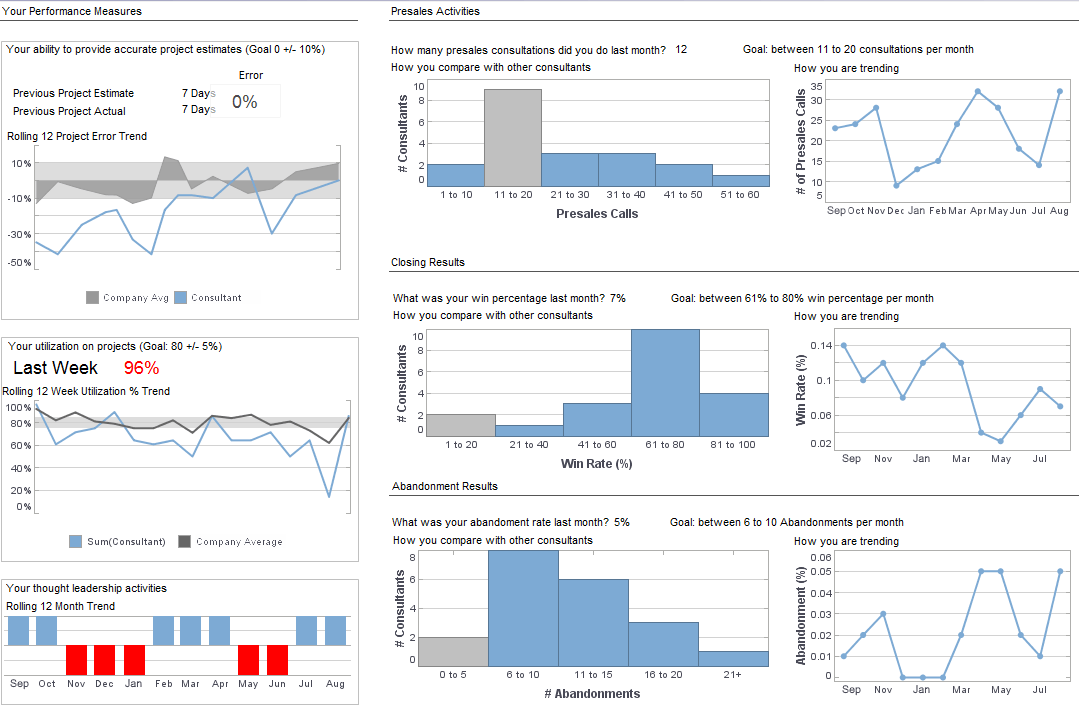
InetSoft Product Information: Dashboard Display
The way information is displayed has great effect on comprehension. InetSoft's dashboard display is fully customizable, allowing you to format information however you feel is best suited for your needs.
A map displays summarized data grouped by physical location in the form of a geographical map.
To create a map, drag the Map element from the Component Tree into the Viewsheet. Then follow the general steps below:
- Bind the map to a Data Block
- Specify the geographical hierarchy
- Resolve geographical names
- Set the initial map view
The following sections discuss each of these steps in turn.
| #1 Ranking: Read how InetSoft was rated #1 for user adoption in G2's user survey-based index | Read More |
Binding the Map to a Data Block
The first general step in creating a map is to bind the map to a Data Block. Follow the steps below:
- Right-click on the map and select ‘Properties’. This opens the ‘Map Properties’ dialog box.
- Click the Data tab.
- From the �Table� menu, select the Data Block that contains the geographical data. To display the aggregate values as tooltips, select �Tooltip� under the General tab.
- From the �Value Column�, choose an aggregate field. The specified aggregate value will be computed for each geographical region.
- From the �Aggregate� menu, select the desired summarization method. (If you choose a bivariate measure, select a second operand from the �With� menu.)
- In the �Value Display� panel, select �Value� if you want to display the aggregate values on the map. Select �Label� if you want to display geographical names (i.e., values from the geography fields specified in Hierarchy tab).
 |
View live interactive examples in InetSoft's dashboard and visualization gallery. |
The second part of creating a map is to specify the geographical hierarchy. Follow the steps below:
- In the ‘Map Properties’ dialog box, select the Hierarchy tab.
- Drag and drop the geographical field(s) of the Data Block into the ‘Geography Columns’ panel (bottom right). This specifies the layer of the geographical database against which field values should be matched (e.g., city names should be matched against the city layer, etc.).
- For each geographical field in the ‘Geography Columns’ panel, select the appropriate geography layer from the corresponding menu.
- For geographical layers that are not specified explicitly in the data set, supply the appropriate layer information in the �Predefined Location� panel. Follow these steps:
- Click the �+� button under �Predefined Location� to add a new layer.
- From the right menu, select the correct geographical information for your data. Repeat the above steps to add all geographical information that is required to resolve the geographical values in the dataset. For example, if your geographical data represents cities in the state of NY, you should set �Continent�, �Nation�, and �State� layers in the 'Predefined Location� panel.
- Click the �Check� button. This opens the �Geographic Feature Names� dialog box. The �Geographic Feature Names� dialog box allows you to verify that all geographical names in the dataset are correctly resolved against the geographical database.
 |
Read the top 10 reasons for selecting InetSoft as your BI partner. |
| Previous: Performance Metrics Dashboard |
Next: Dashboard Development
|
