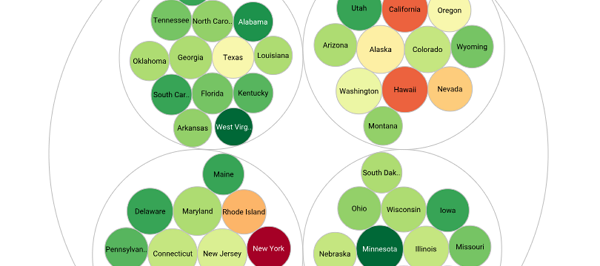
InetSoft's Data Visualization Tool: the Viewsheet
Visualization is the branch of analysis that turns data into visual insight. Traditional data visualization tools were designed for highly trained professionals, such as scientific researchers. These used complicated outputs and statistical models to enable these users to discover low-level patterns.
InetSoft’s visualization application, the Viewsheet, is a business intelligence tool that brings the power of visualization to business executives and mainstream users.
Because Viewsheets allow you to interact with data using familiar objects such as charts, sliders, and check-boxes, they are quick to learn and easy to use. They allow you to seamlessly integrate data warehouses and other BI data stores with operational data sources for a complete view of your organization.
Visualization using Viewsheets goes far beyond the ad hoc querying you might use to find answers to existing questions. With Viewsheets, you will be able to explore your data from every angle, discover new patterns, test new ideas, and envision new opportunities.
Customer Experience Using a Data Visualization Tool
"You actually use more business intelligence capabilities. So in between the execution phase and the final evaluation, you’re constantly tracking and monitoring your performance so you can tune your execution. That’s where business intelligence with dashboards for analysis and monitoring come in.
And in between the evaluation phase and incorporating your learnings or findings and adapting your strategy, you need to do some in-depth analytics.
That’s the more traditional forecasting or predictive analytics as well as things like data mining. So there is a piece that is more business intelligence as it relates to the management system, and then there is a piece that is more performance management, and you couple them together.
After some months of active use of the platform, go back to the users and find out where they get value out of the system, what they’ve been using it for, and start to use those thought leaders, the folks that have been the most aggressive users getting this value out of it. Use them, perhaps, as a way to add the additional performance management capabilities into the organization."
How Does an Urban Planner Use a Data Visualization Tool?
Urban planners leverage data visualization tools as essential aids in analyzing, interpreting, and communicating complex urban data sets. These tools enable planners to make informed decisions, enhance public engagement, and create more sustainable and efficient urban environments. Through data visualization, urban planners can:
-
Spatial Analysis: Data visualization tools help urban planners analyze spatial data, such as land use patterns, transportation networks, and infrastructure. Maps, charts, and graphs provide a visual representation of these elements, aiding in identifying areas for development or improvement.
-
Demographic Analysis: By visualizing demographic data, including population density, age distribution, and socioeconomic factors, planners can gain insights into the needs and preferences of different communities. This information is crucial for designing inclusive and equitable urban spaces.
-
Transportation Planning: Visualization tools assist in analyzing traffic patterns, public transportation usage, and mobility trends. Planners can use interactive maps and charts to optimize transportation systems, identify congestion points, and plan for sustainable and accessible transportation options.
-
Environmental Impact Assessment: Urban planners use data visualization to assess the environmental impact of development projects. This includes visualizing data on air quality, green spaces, and water resources to ensure sustainable and environmentally friendly urban planning.
-
Scenario Planning: Data visualization allows planners to create and compare different development scenarios. By visually representing the potential outcomes of various planning decisions, urban planners can make informed choices that align with long-term urban development goals.
-
Community Engagement: Visualization tools facilitate effective communication with the public. Interactive maps, infographics, and virtual simulations make it easier for community members to understand proposed changes and actively participate in the planning process.
-
Zoning and Land Use Planning: Planners use visualization tools to map zoning regulations and land use plans. This helps in identifying areas designated for residential, commercial, or industrial purposes, ensuring efficient land utilization and zoning compliance.
-
Economic Development: Visualizing economic data, such as business locations, employment rates, and property values, aids in understanding the economic dynamics of an urban area. This information guides decisions related to economic development and revitalization projects.


