Graph Charts
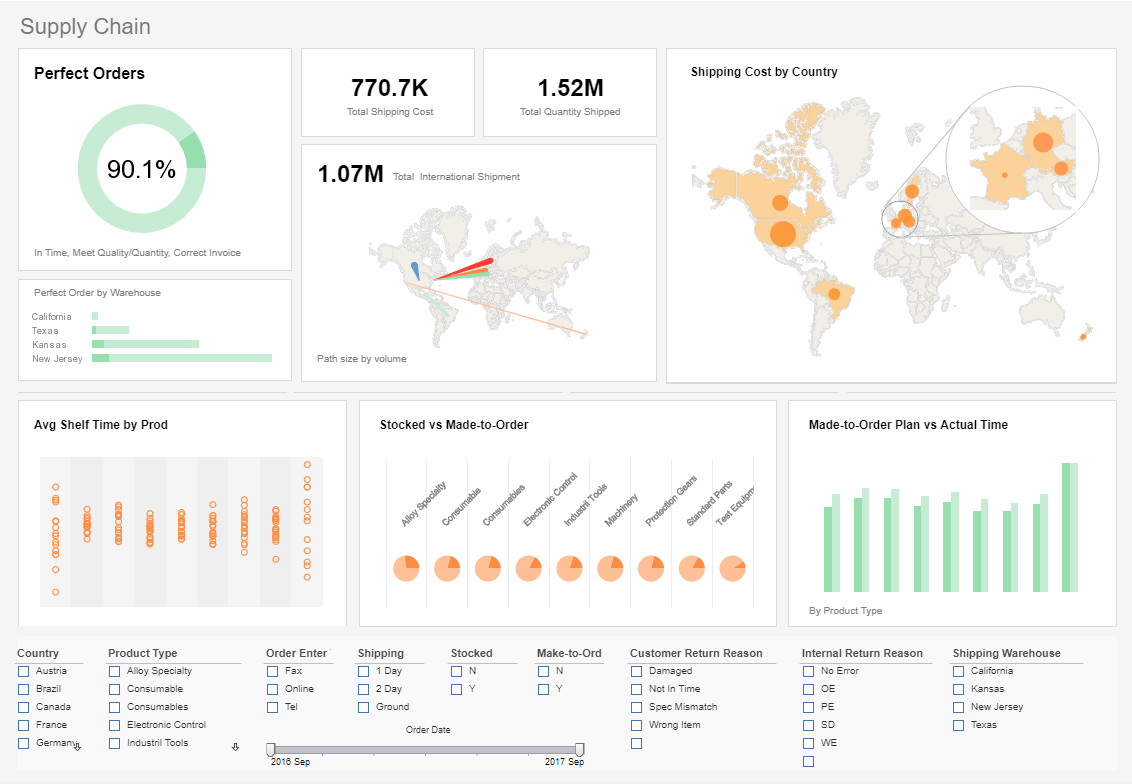
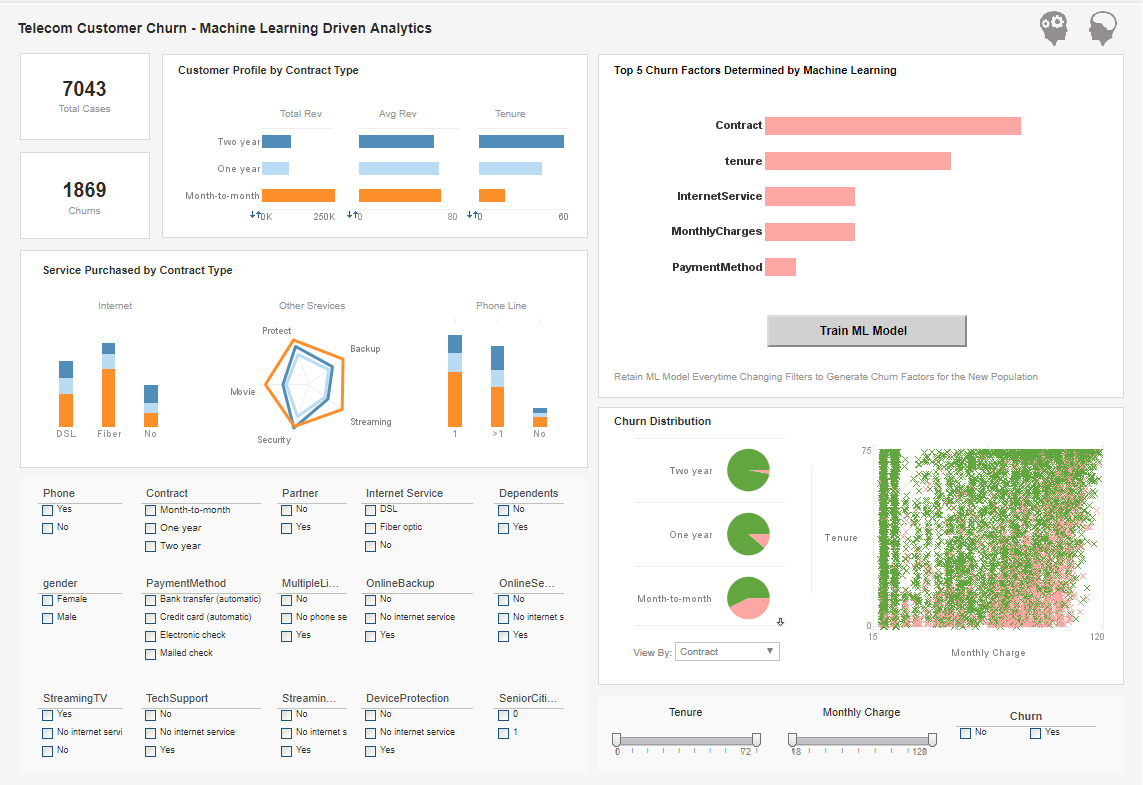
Below are some examples of graph charts generated by InetSoft's graph charting engine. And following is documentation on using InetSoft's JavaScript-like API for programmatically generating charts. Alternatively use InetSoft's drag-and-drop chart designer.


Documentation
TitleSpec.setLabel(value)
Specifies the title text.
Parametervalue a String containing the labelExample (Report or Viewsheet)
importPackage(inetsoft.graph)
importPackage(inetsoft.graph.data)
importPackage(inetsoft.graph.element)
importPackage(inetsoft.graph.aesthetic)
importPackage(inetsoft.graph.scale)
importPackage(inetsoft.graph.coord)
importPackage(inetsoft.graph.guide.form)

var arr = [["State", "Quantity"], ["NJ", 200], ["NY", 300]];
dataset = new DefaultDataSet(arr);
graph = new EGraph();
var elem = new IntervalElement("State", "Quantity");
var spec = new TitleSpec();
spec.setLabel("X Title")
graph.setXTitleSpec(spec);
graph.addElement(elem);
 |
View a 2-minute demonstration of InetSoft's easy, agile, and robust BI software. |
TitleSpec.setTextSpec(spec)
Specifies the legend title.
Parameterspec a TextSpec objectExample (Report or Viewsheet)
 importPackage(inetsoft.graph)
 importPackage(inetsoft.graph.data)
 importPackage(inetsoft.graph.element)
importPackage(inetsoft.graph.aesthetic)
importPackage(inetsoft.graph.scale)
importPackage(inetsoft.graph.coord)
importPackage(inetsoft.graph.guide.form)

var arr = [["State", "Quantity"], ["NJ", 200], ["NY", 300]];
dataset = new DefaultDataSet(arr);
graph = new EGraph();
var elem = new IntervalElement("State", "Quantity");
var titlespec = new TitleSpec();
var textspec = new TextSpec();
textspec.setColor(java.awt.Color(0xff0000));
titlespec.setLabel("X Title")
titlespec.setTextSpec(textspec);
graph.setXTitleSpec(titlespec);
graph.addElement(elem);
| #1 Ranking: Read how InetSoft was rated #1 for user adoption in G2's user survey-based index | Read More |
TextSpec.setBackground(value)
Specifies the label background color.
Parametervalue a java.awt.Color objectExample (Report or Viewsheet)
 importPackage(inetsoft.graph)
 importPackage(inetsoft.graph.data)
 importPackage(inetsoft.graph.element)
 importPackage(inetsoft.graph.aesthetic)
 importPackage(inetsoft.graph.scale)
 importPackage(inetsoft.graph.coord)
 importPackage(inetsoft.graph.guide.form)
 var arr = [["State", "Quantity"], ["NJ",  200], ["NY", 300]];
 dataset = new DefaultDataSet(arr) ;
 graph = new EGraph();
 var elem = new IntervalElement("State", "Quantity");
 var form = new LabelForm();
 form.setLabel("label1");
 form.setValues(['NY', 100]);
 var spec = new TextSpec();
 spec.setBackground(java.awt.Color(0xcccccc));
 form.setTextSpec(spec)
 graph.addForm(form);
 graph.addElement(elem);
More Articles About Graphing
Carbon Footprint Measurement - A key performance indicator (KPI) for sustainability software dashboards is the carbon footprint of a business. The overall greenhouse gas emissions that are both directly and indirectly related to an organization's operations are measured by this KPI. Businesses may establish emission reduction objectives and find areas for improvement by using advanced analytics to help break down emissions by source...
Case Study of the Bureau of Land Management - To effectively measure the outcomes of its activities, the BLM utilizes a range of metrics and monitoring techniques. These may include tracking changes in land use patterns, assessing the health of ecosystems, and evaluating the socio-economic impacts of resource development projects. By collecting and analyzing data over time, the BLM can gauge the effectiveness of its management strategies and make informed decisions about future actions. Additionally, the BLM often collaborates with academic institutions, research organizations, and other governmental agencies to leverage expertise and resources in monitoring and evaluation efforts. In recent years, there has been growing recognition within the BLM of the importance of incorporating principles of adaptive management into its planning and measurement processes...
Corrections Facility Metrics - The warden of a corrections facility, also known as a prison or jail, oversees the daily operations and management of the facility, ensuring safety, security, and compliance with regulations. Business intelligence (BI) metrics play a crucial role in helping wardens make informed decisions, optimize resource allocation, and improve the overall efficiency and effectiveness of the corrections facility. Here are some common BI metrics that a warden may track: Inmate Population: Tracking the total number of inmates housed in the facility provides essential insights into capacity management, resource allocation, and staffing requirements. This metric includes both sentenced inmates and pretrial detainees...
Deploying Java-based Dashboards in a .NET Environment - Deploying Java-based dashboards in a .NET environment can present several technical considerations that must be addressed to ensure seamless integration and optimal performance. These considerations span compatibility, integration, security, performance, and maintenance aspects. Here's a detailed exploration of these considerations: Ensure that the Java-based dashboards are compatible with the .NET environment. This includes verifying that both Java and .NET frameworks can coexist without conflicts...
Evaluate InetSoft's Software for Generating Analytics Reports - Are you looking for good software for generating analytics report? InetSoft's pioneering dashboard reporting application produces great-looking web-based reports with an easy-to-use drag-and-drop designer. View a demo and try interactive examples...
Looking for the Best Performance Management Tools - InetSoft has provided performance management tools that are easy, agile, and robust - complete with interactive and monitoring dashboards, scorecards, and drill-down business reporting. Evaluate InetSoft's Style Intelligence for an affordably priced, quick to deploy, and easy to use performance management process...
| Previous: Drawing Graph |
Next: Dashboard Code
|