Rich Reporting for BI Interactivity
This a continuation of the transcript of a Webinar hosted by InetSoft titled "What's New in BI." The speaker is Mark Flaherty, CMO at InetSoft.
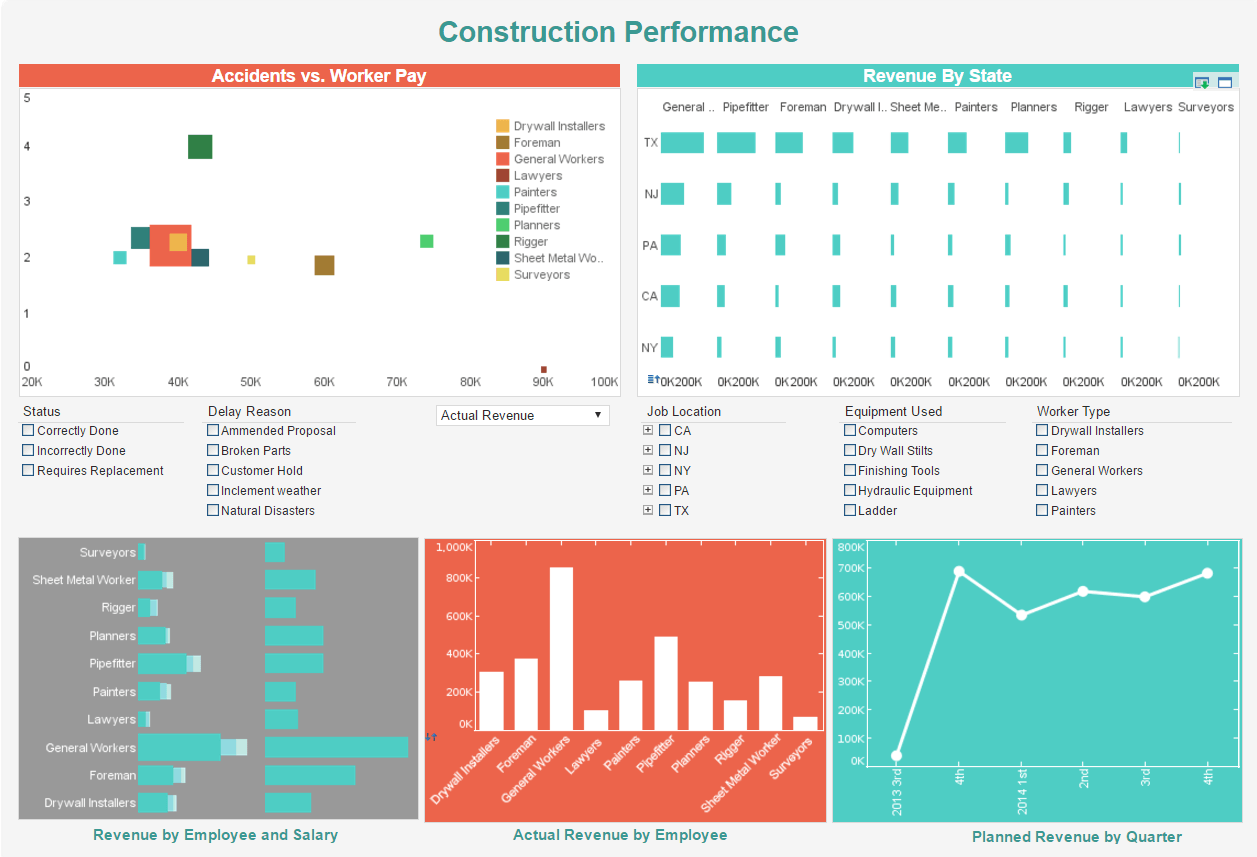
Mark Flaherty: So which graphics rendering technology will win out? Today HTML5 is the predominant technology for delivering that animation or what can be called rich reporting. You also have to look at the build process for you to take advantage of a technology.
In the best world, you have an existing report or an existing dashboard and you do a simple ‘save as’ and enhance it with animation. That would be the ideal. But the reality is today you have to use a separate design environment.
There is still so much that is left to the imagination of the developer how you use the animation. We, too, are providing a tool set and a blank canvas for you to design whatever interactive report or dashboard you wish. And because this is still emerging, you have to think of some best practices around when to use it.
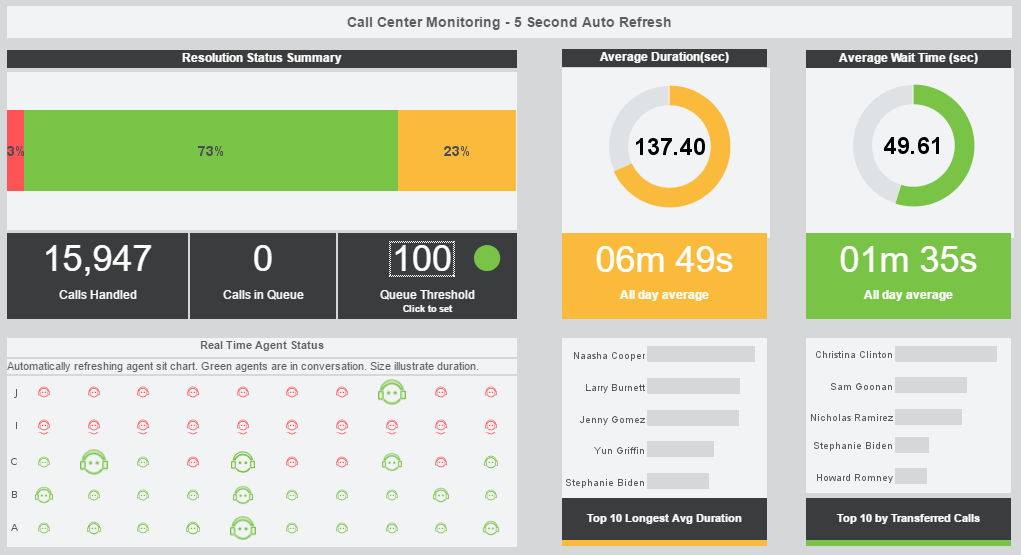
So besides making information more appealing, it can also make information more actionable. Imagine an animation that shows within a dashboard if you are getting low on inventory or if your actual expenses are exceeding your budget, and maybe there is a red flashing indicator that is telling you to go and investigate that.
| #1 Ranking: Read how InetSoft was rated #1 for user adoption in G2's user survey-based index | Read More |
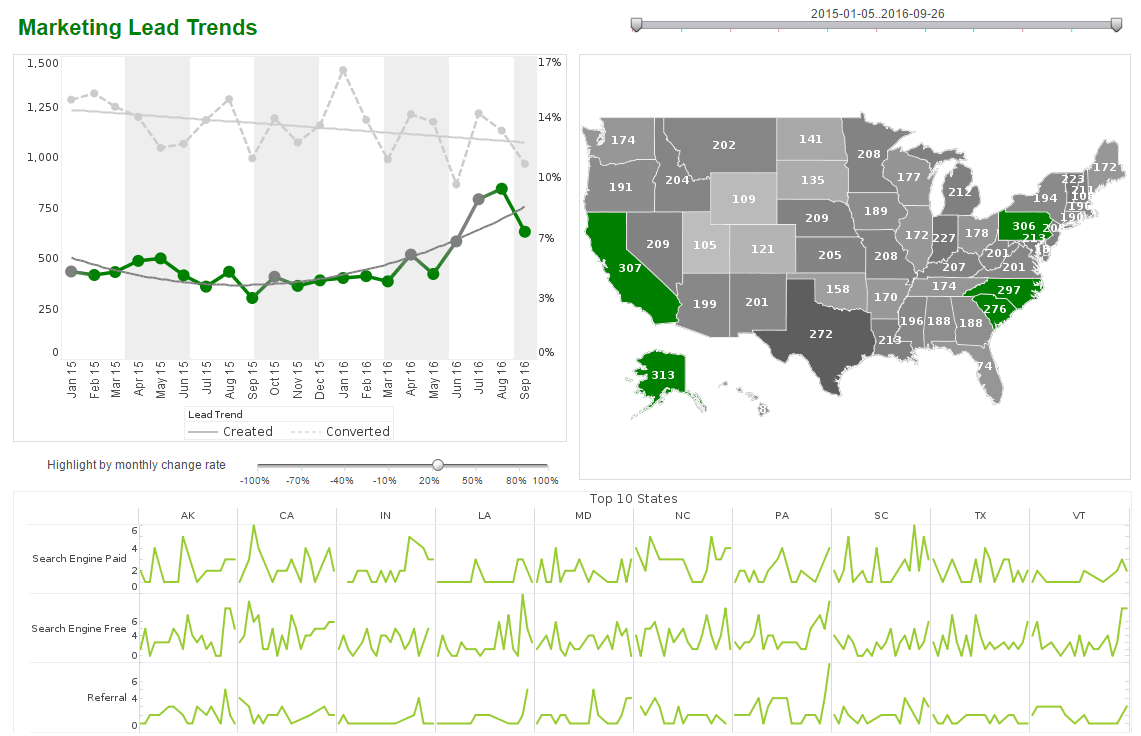
Where does the industry stand? Rich reporting is gaining in maturity. The value is in that interface appeal, but it’s also making BI more interactive when you’re mobile, and has the potential to highlight what’s important, so speeding up that time to insight, what should you be paying attention to. In terms of positioning, this is an innovation that provides value for all users across the full user spectrum.
So given that, I would recommend that this is an innovation that all organizations should be leveraging, but make sure you are considering best practices for effective use. One data point I saw recently is that only 43% of companies are taking advantage of this. So while the technology is fairly mature, it’s use is still in the minority.
Customer Testimonial
InetSoft is a pioneering developer of business reporting software with fifteen years of experience providing dashboard and reporting solutions to enterprises and OEMs. The company’s flagship BI application, named Style Intelligence, is a full-featured business intelligence solution that is 100% Java at the server level and HTML5 and JavaScript at the client level. The Web-based BI solution’s SOA architecture and open standards-based technology make it ideal for wide-scale deployment as a standalone application or for rapid embedding into other Web-based solutions.
The product’s high-performance data access engine and data mashup capability allows organizations to combine disparate data sources ranging from data warehouses to operational data stores such as those in ERP or CRM applications to Web service data feeds.
“We selected InetSoft as our preferred business intelligence solution” commented Steve Wilson, MD at CampionPPS, “because it is so easy for end-users to get to grips with, it’s very quick to get up and running, it’s affordable for our clients, and it’s a very powerful and robust business intelligence solution that can make a real difference to our client’s business performance”.


 |
Read why choosing InetSoft's cloud-flexible BI provides advantages over other BI options. |
What Makes for a Robust Business Intelligence Solution?
A robust business intelligence (BI) solution is one that empowers organizations to efficiently gather, analyze, and leverage data to make informed decisions. It goes beyond basic reporting to deliver a comprehensive platform that supports strategic planning, operational efficiency, and innovation. Here are the key components that define a robust BI solution:
1. Comprehensive Data Integration
A robust BI solution must seamlessly integrate data from multiple sources, such as databases, spreadsheets, CRM systems, ERP platforms, and external APIs. The ability to unify disparate datasets ensures a holistic view of business operations, enabling accurate analysis and decision-making. Advanced ETL (Extract, Transform, Load) capabilities, along with support for real-time data streams, are essential for maintaining data consistency and currency.
2. Powerful Analytics Tools
At its core, a robust BI solution must offer advanced analytics capabilities, including descriptive, diagnostic, predictive, and prescriptive analytics. These tools allow businesses to understand past performance, identify patterns and anomalies, forecast future trends, and optimize strategies. Features like natural language processing (NLP), machine learning (ML), and statistical modeling further enhance analytical power, making it easier to uncover actionable insights.
3. Interactive and Intuitive Visualizations
High-quality visualizations are critical for transforming complex data into digestible insights. A robust BI solution should offer customizable dashboards, charts, graphs, and interactive tools like drill-downs and filters. These features enable users to explore data dynamically and uncover insights tailored to their needs. Intuitive design ensures that users at all skill levels can interact with the data effectively, fostering a data-driven culture throughout the organization.
4. Scalability and Flexibility
As businesses grow and evolve, their BI needs become more complex. A robust solution must scale seamlessly to accommodate growing datasets, more users, and increasingly sophisticated analytics. It should also be flexible, allowing customization to meet industry-specific requirements or unique organizational workflows. Cloud-based BI platforms often excel in scalability and flexibility, offering pay-as-you-go models and the ability to expand resources on demand.
5. Security and Compliance
Data security and regulatory compliance are non-negotiable for any BI solution. A robust system must provide robust encryption, role-based access controls, and regular security updates to safeguard sensitive data. Additionally, it should support compliance with industry standards such as GDPR, HIPAA, or CCPA, ensuring that the organization avoids legal and reputational risks.
6. Ease of Use and Self-Service Capabilities
Modern BI solutions must cater to both technical and non-technical users. Self-service BI features, such as drag-and-drop interfaces and automated insights, empower employees across departments to analyze data without relying on IT teams. This democratization of data fosters a culture of independence and agility, enabling faster, data-driven decisions.
7. Real-Time and Mobile Accessibility
In today's fast-paced business environment, real-time insights and mobile accessibility are vital. A robust BI solution should offer real-time data processing and allow users to access insights on-the-go via mobile apps or web interfaces. This ensures that decision-makers are equipped with up-to-date information, regardless of their location.
| Previous: Rich Reporting |
Next: Advanced Visualization
|


