Visualize Data in Your JSP Web Applications
Looking for tools to visualize data in your JSP Web application? InetSoft provides both free and commercial Web chart graphing tools and has designed them to be embedding friendly. Embedded dashboards and reports must be transparent to the end-user and must look and feel like a normal part of the host application - whether it is used by either internal users or external customers.
Many data intelligence solution providers have built static dashboards, but with InetSoft's 100% web-based application, you'll be able to add self-service visual analytics.
View a demo and try the app for free.


The code samples below illustrates how the application can be controlled with a JavaScript-like API.
LinearSizeFrame
The LinearSizeFrame object contains a frame that linearly maps numerical data values to sizes. To create a LinearSizeFrame object, call the LinearSizeFrame constructor.
 importPackage(inetsoft.graph.aesthetic);
 var frame = new LinearSizeFrame('Quantity');
You can pass the name of a field (e.g., 'Quantity') to the constructor, or specify this later using the inherited VisualFrame.setField(field) property.
Example (Report)
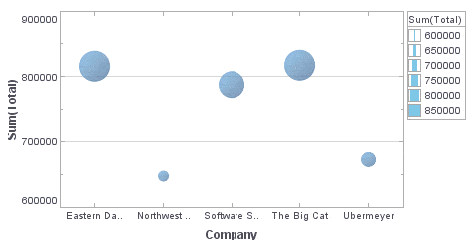
Bind a point-type chart to the sample 'All Sales' query, with 'Company' (top 5) on the X-axis, and Sum(Total) on the Y-axis. Add the following script in the onLoad Handler.
importPackage(inetsoft.graph.aesthetic);
Graph1.bindingInfo.setSizeField("Total",Chart.NUMBER)
Graph1.bindingInfo.sizeFrame = new LinearSizeFrame;
Example (Report or Viewsheet)
importPackage(inetsoft.graph)
importPackage(inetsoft.graph.element)
importPackage(inetsoft.graph.scale)
importPackage(inetsoft.graph.aesthetic)
importPackage(inetsoft.graph.data)

var arr = [["State", "Quantity", "width"], ["NJ", 200, 5],
           ["NY", 300,10], ["PA",75,15]];
dataset = new DefaultDataSet(arr);
graph = new EGraph();
var elem = new IntervalElement("State", "Quantity");
var frame = new LinearSizeFrame();
frame.setField("width");
frame.setSmallest(10);
frame.setLargest(50);
frame.setMax(100);
elem.setSizeFrame(frame);
graph.addElement(elem);

CategoricalSizeFrame
The CategoricalSizeFrame object contains a frame that assigns a unique size to each distinct value. To create a CategoricalSizeFrame object, call the CategoricalSizeFrame constructor.
 importPackage(inetsoft.graph.aesthetic);
 var frame = new CategoricalSizeFrame('State');
Example (Report)
Bind a point-type chart to the sample 'All Sales' query, with 'Company' (top 5) on the X-axis, and Sum(Total) on the Y-axis. Add the following script in the onLoad Handler.
importPackage(inetsoft.graph.aesthetic);
Graph1.bindingInfo.setSizeField("Employee",Chart.STRING)
Graph1.bindingInfo.sizeFrame = new CategoricalSizeFrame;
Example (Viewsheet or Report)
importPackage(inetsoft.graph)
importPackage(inetsoft.graph.element)
importPackage(inetsoft.graph.scale)
importPackage(inetsoft.graph.aesthetic)
importPackage(inetsoft.graph.data)
var arr = [["State", "Quantity"], ["NJ", 200],
           ["NY", 300], ["PA", 75]];

dataset = new DefaultDataSet(arr);
graph = new EGraph();
var elem = new IntervalElement("State", "Quantity");
var frame = new CategoricalSizeFrame();
frame.setField("State");
elem.setSizeFrame(frame);
graph.addElement(elem);

CategoricalSizeFrame.setSize(val,size)
Assigns a size to the specified value.
Parameter
val
 a data value size size at which to represent data value
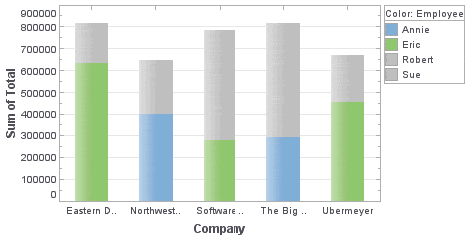
Example (Report)
Bind a point-type chart to the sample 'All Sales' query, with 'Company' (top 5) on the X-axis, and Sum(Total) on the Y-axis. Add the following script in the onLoad Handler.
importPackage(inetsoft.graph.aesthetic);
Graph1.bindingInfo.setSizeField("Employee",Chart.STRING)
Graph1.bindingInfo.sizeFrame = new CategoricalSizeFrame;
Graph1.bindingInfo.sizeFrame.setSize('Robert',20);
Graph1.bindingInfo.sizeFrame.setSize('Eric',20)
Graph1.bindingInfo.sizeFrame.setSize('Sue',5);
Graph1.bindingInfo.sizeFrame.setSize('Annie',5);
Example (Report or Viewsheet)
importPackage(inetsoft.graph)
importPackage(inetsoft.graph.element)
importPackage(inetsoft.graph.scale)
importPackage(inetsoft.graph.aesthetic)
importPackage(inetsoft.graph.data)

var arr = [["State", "Quantity"], ["NJ", 200],
           ["NY", 300], ["PA", 75]];
dataset = new DefaultDataSet(arr);
graph = new EGraph();
var elem = new IntervalElement("State", "Quantity")
var frame = new CategoricalSizeFrame();
frame.setField("State");
frame.setSize('NJ',5);
frame.setSize('NY',10);
frame.setSize('PA',20);
elem.setSizeFrame(frame);
graph.addElement(elem);

More Articles About Visualizing Data
Building Comprehensive Analyses - Style Intelligence offers an interface for building comprehensive analyses in the form of interactive multidimensional charts, giving you direct access to insights that used to require several pages of reporting to put together. The application provides a wide array of filtering options, such as sliders, rulers, and selection lists, which you can use to modify visualizations and manipulate metrics in real time. SI also boasts the ability to access data from many disparate sources, effectively freeing the user from the constraint of needing a data warehouse or any single consolidated source of information. Here is a solution which is simple to implement, easy to learn, and even easier to use. After a quick deployment of Style Intelligence with some help from your IT staff, the benefits a manager or executive is seeking from analytical dashboards become immediately apparent...
Fraud Detection Rate - The organization's fraud detection systems' efficiency in discovering and averting fraudulent transactions is gauged by its fraud detection rate. Payment operations analysts can improve fraud detection algorithms, evaluate the efficacy of fraud protection technologies, and put precautions in place by studying this KPI. A stronger fraud protection plan is shown by a better fraud detection rate, which guards against financial losses for the company...
InetSoft Compared to Pentaho - Users find the Style Intelligence GUI very reliable, from the end-user perspective it's also very intuitive, easy to understand and to implement the creation of reports and dashboards with its ability to integrate and join data from various sources, all that leads Style Intelligence to beat Pentaho in building reports, Data Visualization, Big Data services, Data Modeling, Data trasnformation, Data API's, WYSIWYG Report Design. Pentaho as a competitor on the other side is not an intuitive platform that allows quick and great progress according to users, new users need to learn a lot to be able to perform specific analysis and reporting tasks, and that makes users feel more comfortable with Style Intelligence...
Project Scope KPIs - The effort required to get the intended result is referred to as the project's scope. Project analysts may gauge a project's advancement in relation to its initial scope with the use of project scope KPIs. The most typical scope KPIs are as follows: Scope Creep: Any unauthorized additions or modifications to the project scope are referred to as scope creep. Monitoring changes in the project's scope over time will allow project analysts to assess scope creep. Requirements Coverage: The proportion of the project's requirements that have been met is measured by requirements coverage. Project analysts may check if all project criteria are being satisfied with the use of this KPI. Deliverable Completion: The proportion of project deliverables that have been finished is measured by delivery completion. Project analysts may use this KPI to monitor if all project deliverables are being made on schedule and within budget...
Requirements Management KPIs - Good requirements management is essential to making sure a project or product is delivered successfully. Managing requirements entails acquiring, documenting, and verifying requirements, monitoring changes, and ensuring they meet project goals. This is where requirements management dashboards may assist teams obtain insights, make educated choices, and enhance software or project quality. This article discusses requirements management dashboard KPIs and analytics and their role in the software development lifecycle. Traceability Matrix Completion Rate: The proportion of needs that have been successfully tracked down to their original sources is measured by this KPI. A greater percentage of completion signifies a stronger traceability, lowering the possibility of criteria being overlooked...
Revenue Cycle Management Dashboards - A critical component of maintaining the financial stability of healthcare businesses is revenue cycle management, or RCM. Organizations use complicated dashboards with analytics and Key Performance Indicators (KPIs) to effectively manage the intricacies of revenue cycles. These resources provide priceless insights into the organization's financial health and support decision-making by stakeholders. This article examines Revenue Cycle Management dashboard KPIs and analytics and their use in financial process optimization. Days in Accounts Receivable (DAR) is one of the core KPIs in dashboards for revenue cycle management. The average number of days it takes a healthcare company to be paid after rendering services is measured by this KPI. A lower DAR suggests that the company is collecting payments on time and has a more effective revenue cycle...
This Year's Top Business Intelligence Tools - The proper set of business intelligence tools empower an organization's entire staff. IT is given new insight into business operations. Sales are welcomed into a bright new world of increased possibility with the advent of BI tools for CRM software. Finance and accounting professionals will find it much simpler to keep track of data. All business users, and subsequently the business itself, greatly benefit from a solid amalgamation of top business intelligence tools. BI tools come in many different shapes and sizes. The simplest BI tool and cog in the realm of business intelligence is spreadsheets. Spreadsheets are used to collate data into a meaningful form, but quickly become overwhelming...