InetSoft StyleBI vs. Google Charts - How do they compare?
How does InetSoft compare to Google Charts? Business software comparison site G2 Crowd weighed in and showed that InetSoft beat Google Charts hands down by 86% of user ratings. G2 is known for its unbiased platform where real certified reviewers share their feedback. These reviews are weighed against data from web traffic including LinkedIn, Twitter and other social media platforms.
The ratings are broken up into multiple categories that cover all aspects of the software so businesses can choose a BI vendor that meets their specific needs. In General Ratings, InetSoft beat Google Charts in 6 out of 7 categories, including Ease of Use, Ease of Setup, and Quality Support.
This is not surprising since InetSoft is known for its highly scalable, robust platform with sophisticated data mashup capabilities that supplement or eliminate the need for IT-intensive ETL and data warehouses. With InetSoft, you do not need to be a data scientist or programmer to utilize sophisticated, interactive dashboards and reports.


A More Flexible Alternative to Google Charts
On the G2 Crowd website, reviewers raved about InetSoft's flexibility that allows end users to do almost anything they can imagine with their data, including complicated mashups and reporting that delivers valuable insights with ease. The highly visual graphics and drag-and-drop features were noted amongst consumers for saving time, resources, and increasing company efficiency.
On top of all that, InetSoft's open source web based architecture allows for faster and easier use due to its easy integration with multiple data sources. Another aspect that favored InetSoft was its quality support. End users were in agreement about the good communication received from the product managers and team.
Quality Support
Not only does InetSoft deliver excellence in business intelligence and reporting software, but they value customer satisfaction and happiness. Their team of dedicated developers and account managers all work together to ensure quality service and experience. They also provide an array of resources to help customers stay informed. InetSoft offers a developer portal that includes five categories of useful resources broken down and organized in a clear, easy to manage manner which are:
- Documentation- Access to all InetSoft product documents
- Tutorial Videos- Library of product training and how-to videos
- Support Center- Easy access to InetSoft support staff where you can submit support issues and review them
- Download- For first time users who would like to try InetSoft's free software
- Test Drive- This free web portal is available for unlimited use so customers can make an informed decision before making a purchase. Customers can also request a personalized demo to see how InetSoft can help their specific needs within their company.
InetSoft also provides a forum to its users that includes the latest updates to StyleBI, tutorial videos, webinars, and everything end users would need to ensure maximum use and benefits are received. Independent users liked that the StyleIintelligence tool is so easy to use that they were able to teach it to themselves and noted that the reference videos provided clear help with troubleshooting. With the tutorial videos, documentations, forum, ease of communication between end users and InetSoft's team, low costs, and drag-and-drop features it's no wonder people are trusting InetSoft for their reporting, dashboard, and visual analysis needs.
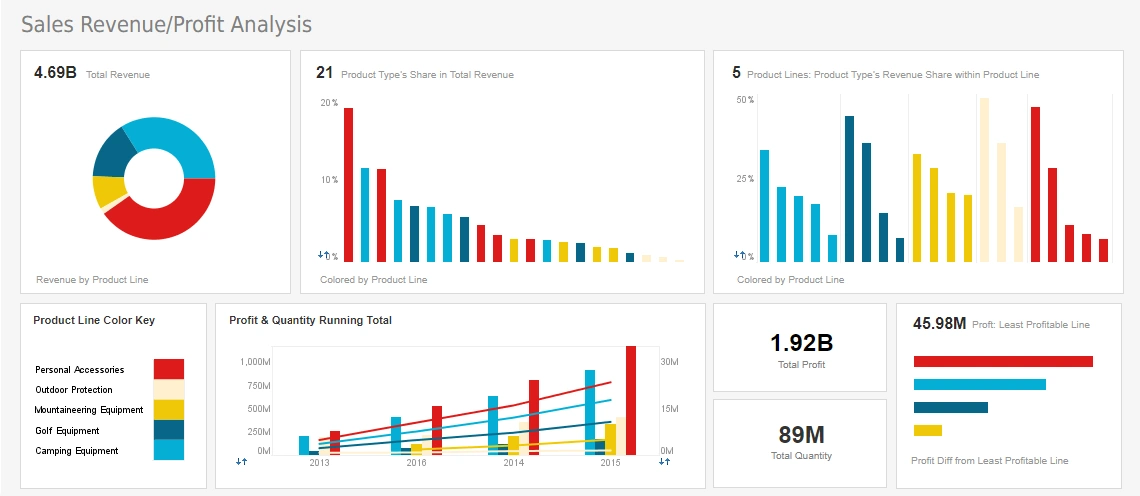
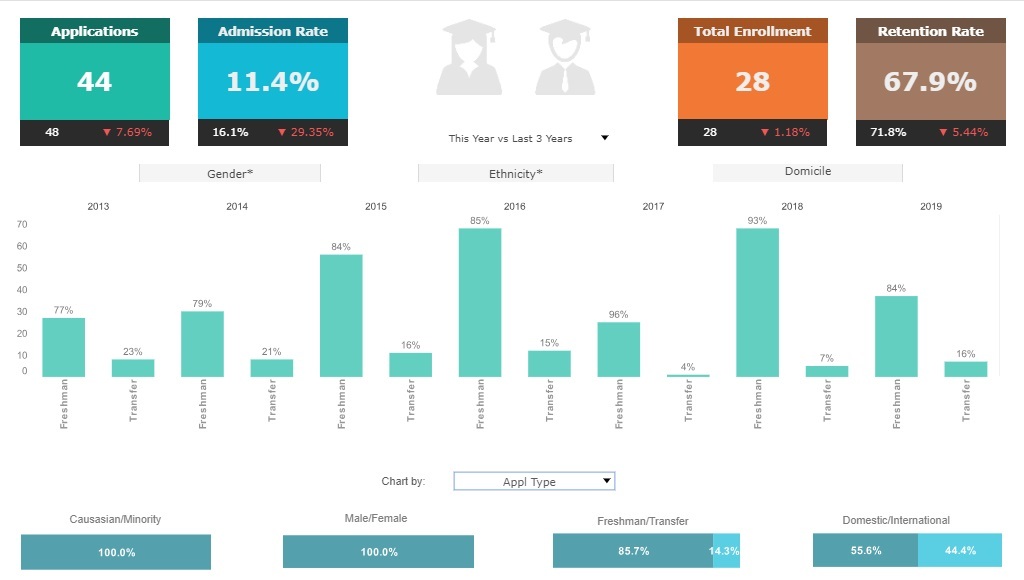
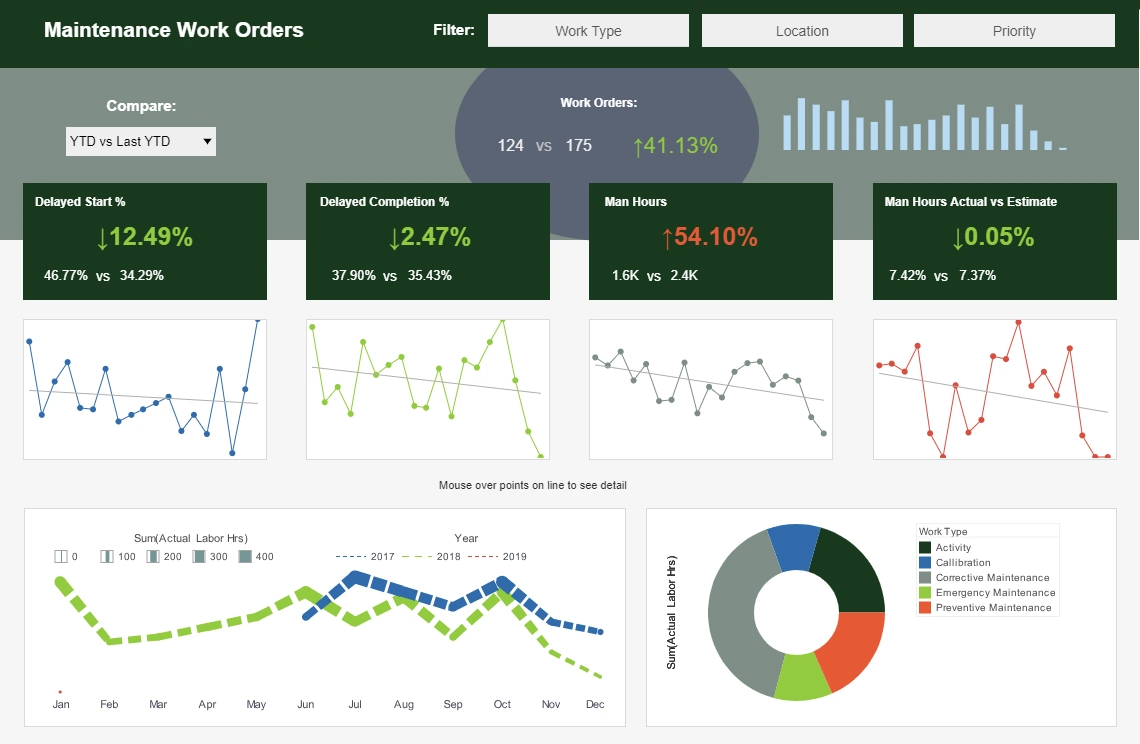
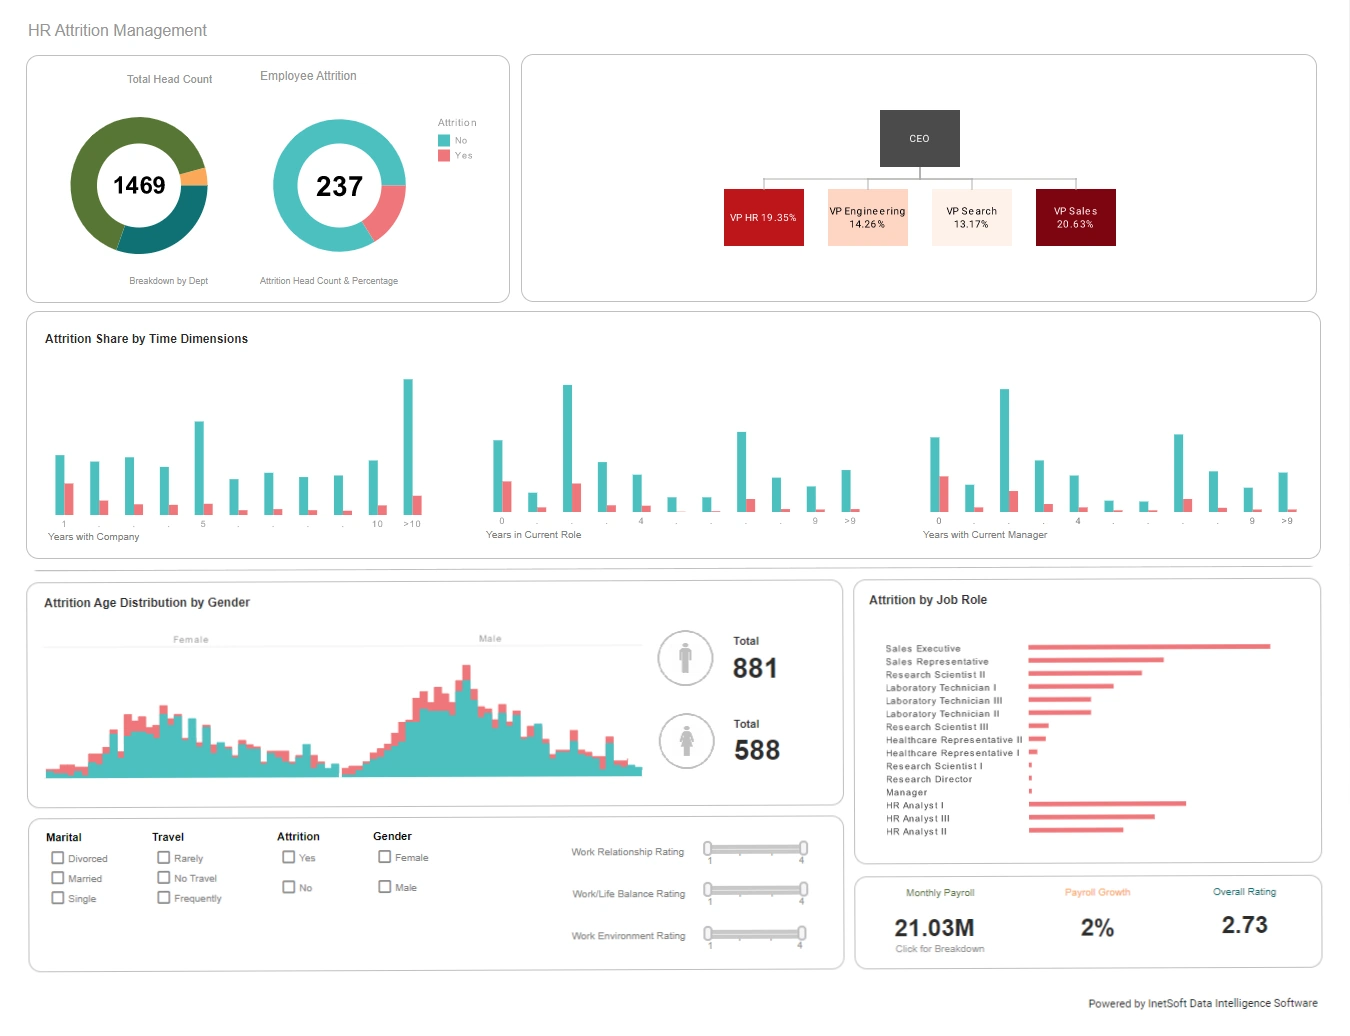
Reports | Building Reports
Independent users were happy with InetSofts Reporting capabilities and chose InetSoft in 7 out of 9 feature categories including WYSIWYG report design. In the computing world WYSIWYG stands for "what you see is what you get," referring to the extent to which content such as text and graphics can be edited in a manner that maintains the desired appearance when the finished product is printed or displayed. In addition to WYSIWYG, InetSoft outshined the competition in Reports Interface, Steps to Answer, Scorecards, Dashboards, Data Transformation and Data Modeling.
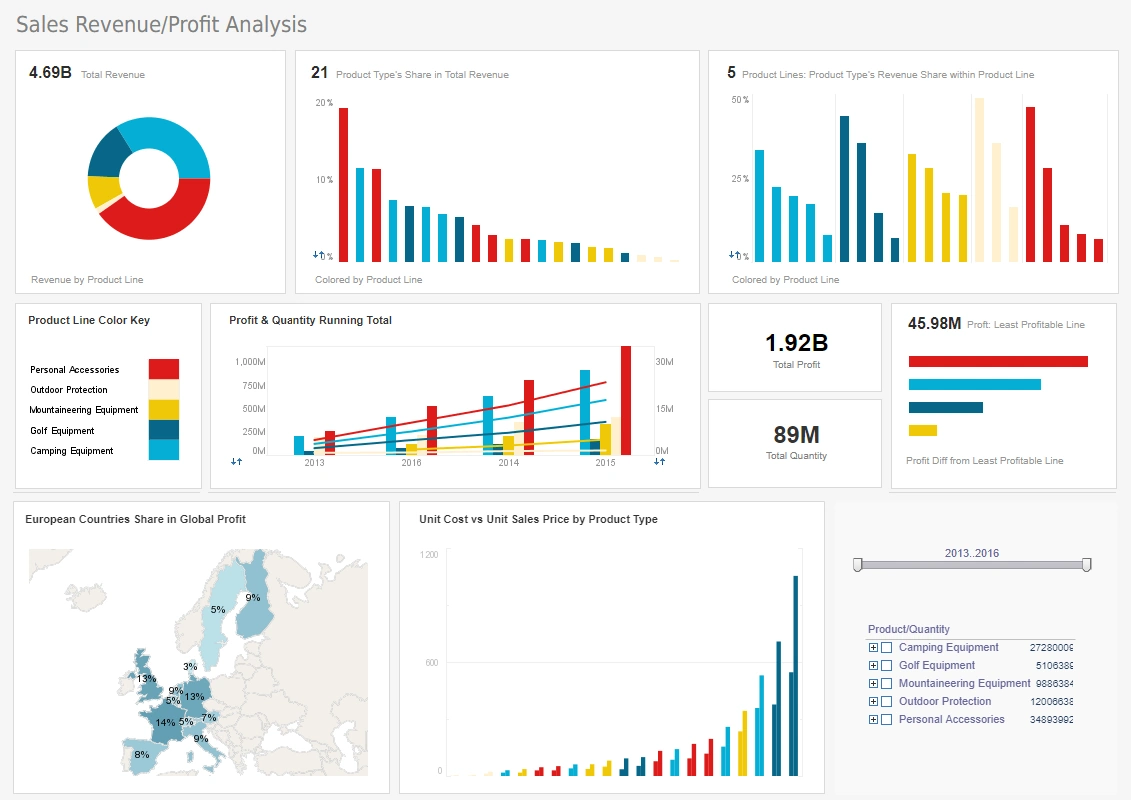
Advanced Analytics
In advanced Analytics InetSoft won 75% of categories, including Data Visualization and Big Data Services. These categories are crucial because the whole purpose of business intelligence products are to provide companies with easy visual analysis. As the pioneer of data mashup capabilities it is no surprise that InetSoft excels in visual analytics. InetSofts data mashup engine integrates data in real time from a large variety of sources, giving users immediate access to fresh information. Another aspect that sets InetSoft apart from the crowd is its low footprint, ensuring that for companies that implement this software on their own systems, critical applications will be able to run smoothly and unhampered.
Why Upgrade from Google Charts to StyleBI?
Current Strengths of Google Charts
Google Charts offers a broad gallery of chart types, uses HTML5/SVG for good browser compatibility, and is relatively easy to embed and use for simple visualizations. It’s well-suited for web developers needing quick charts with minimal setup.
However, as analytic needs grow in complexity, limitations appear—particularly around data integration, dashboarding, embeddability at scale and enterprise-features.
What StyleBI Brings That Google Charts Doesn’t
StyleBI by InetSoft Technology Corporation provides a richer and more enterprise-capable platform compared to a standalone charting library like Google Charts. Key differentiators include:
- Data mash-up and connectivity: StyleBI supports combining multiple diverse data sources—databases, cloud services, spreadsheets—and creating dashboards from blended data.
- Advanced visualizations & dashboarding: Beyond simple charts, StyleBI offers extensive visual types, interactive dashboards, self-service filtering, and layout flexibility suitable for executive-dashboards and embedding.
- Embedding & application integration: StyleBI supports iframe embedding, JavaScript API, REST API, and seamless integration with SaaS applications for analytics as part of a product.
- Enterprise features: Includes security (row/column-level), single-sign-on, multi-tenant support, real-time and scheduled data refreshes, and scalable architecture for broader deployment.

When the Upgrade Makes Sense
An upgrade from Google Charts to StyleBI is advisable when any of the following apply:
- Dashboard complexity: If dashboards need to integrate multiple data sources, provide advanced filtering or drill-down, and support business-user self-service rather than just static charts.
- Embedding analytics: If analytics are being embedded in a product, or need white-labeling, custom branding, and deep integration with the application UI/UX.
- Scalability and governance: If the solution must support many users, data governance, role-based access, and enterprise-scale deployment rather than simple chart inclusion.
- Operational analytics: If you require scheduled reporting, materialized views, dashboards updated in real-time or near-real-time, multi-tenant environments, etc.
Considerations Before Moving
Upgrading involves trade-offs and investment. The move from Google Charts to a full BI platform like StyleBI means:
- Potentially higher cost—licensing, infrastructure, hosting, maintenance.
- A learning curve—business users and developers may need training in the richer features and architecture.
- Integration and governance work—data modelling, security configuration, refresh schedules and embedding APIs must be managed.
In short: for simple charting and embedding where your needs remain modest, Google Charts may remain sufficient. But when analytics are becoming central to your application, product, or decision-making process—where data sources multiply, users scale, embedding matters, governance matters—StyleBI provides the next level of capability.