Business Intelligence Web Applications
Web-based BI applications offer users freedom that desktop programs cannot compete with. You can take Web applications with you on your phone or on your tablet. You are constantly connected to your data. InetSoft's StyleBI is a zero-client tool for internet reporting. As such, it has many benefits over its desktop-bound competitors.
Benefits of Web Applications
StyleBI does not require powerful hardware to run properly. There are no real physical requirements to run StyleBI. Any Web browser has the capability to run the software, including mobile.
Android tablets, iPhones, iPads, and any other device with a browser is fully capable of running Style Intelligence.
Online applications let users share information with any number of end users, at home or abroad, with minimal labor. They permit users to send reports and dashboards to all those involved, drastically increasing the speed of decision making and, in turn, efficiency of a business.


A Complete Business Intelligence System
In order to stand above the rest, InetSoft's StyleBI platform presents several innovations above the capabilities of the typical Web-based BI model.
InetSoft StyleBI is an operational business intelligence platform that features a powerful data mashup engine for the creation of dashboards, visual analyses, and reporting. The unified, easy-to-deploy, easy-to-use business intelligence solution maximizes self-service and serves both enterprises and solution providers.
InetSoft's BI software leverages a powerful patent-pending Data Block™ foundation for real-time data mashup and presents information through interactive dashboards, enterprise reporting, scorecards, and exception alerts.
In contrast to other business intelligence applications that provide only reporting, or only dashboards, or require an intermediate data access layer, InetSoft's business intelligence system is complete. It includes analytics software and sophisticated reporting capabilities plus direct access to almost any data source.
The small footprint, SOA and Java architecture delivers an embedding and integration ready platform that delivers analytic business intelligence within business processes.
Leveraging InetSoft's StyleBI for Web-Based Hydrogen Sulfide Monitoring Analytics
Hydrogen sulfide (H₂S) is a highly toxic gas commonly found in oil and gas facilities, wastewater treatment plants, and chemical manufacturing. Continuous monitoring of H₂S levels is critical to ensuring worker safety and regulatory compliance. A leading manufacturer of hydrogen sulfide monitors has adopted InetSoft's open-source BI application, StyleBI, to deliver web-based reports and dashboards that provide real-time insights into gas exposure levels, equipment performance, and compliance trends.
By integrating StyleBI, the manufacturer enables its clients to visualize sensor data, generate compliance reports, and analyze trends through interactive dashboards. This article explores how the manufacturer uses StyleBI's charts, analytics, and data modeling capabilities to enhance safety monitoring and operational efficiency.
Why StyleBI for Hydrogen Sulfide Monitoring?
StyleBI is a lightweight, embeddable BI tool that allows organizations to create dynamic, web-based dashboards without heavy infrastructure requirements. Key benefits for the H₂S monitor manufacturer include:
- Real-time Data Integration – StyleBI connects directly to sensor databases, enabling live updates of gas concentration levels.
- Customizable Dashboards – Users can tailor views based on facility needs, from high-level summaries to granular sensor analytics.
- Open-Source Flexibility – The manufacturer can modify and extend StyleBI's functionality to meet industry-specific reporting requirements.
- Embeddable Analytics – Reports can be embedded into existing safety management systems, reducing the need for separate BI tools.
Next, we'll explore the key dashboards and analytics used in their implementation.
Key Dashboards & Analytics for H₂S Monitoring
1. Real-Time Exposure Monitoring Dashboard
This dashboard provides live readings from H₂S sensors across a facility, alerting safety personnel when thresholds are exceeded.
Charts & Visualizations Used:
- Gauge Charts – Display real-time H₂S concentration levels (ppm) with color-coded thresholds (green = safe, yellow = warning, red = danger).
- Geospatial Heatmaps – Show sensor locations and exposure hotspots across a facility floor plan.
- Time-Series Line Graphs – Track gas levels over time to identify peak exposure periods.
Analytics Features:
- Threshold Alerts – Automated notifications when H₂S exceeds OSHA Permissible Exposure Limits (PEL: 20 ppm).
- Rolling Averages – Calculates 8-hour TWA (Time-Weighted Average) for compliance reporting.
2. Compliance & Regulatory Reporting
Many industries must document H₂S exposure levels for OSHA, EPA, and other regulatory bodies. StyleBI automates these reports, reducing manual data collection.
Charts & Visualizations Used:
- Bar Charts – Compare exposure levels across different worksites or time periods.
- Tabular Reports – Exportable PDF/Excel reports with timestamps, sensor IDs, and exceedance records.
- Pareto Charts – Identify the most frequent exposure violations by location or shift.
Analytics Features:
- Automated PDF Generation – Scheduled reports sent to compliance officers.
- Drill-Down Capability – Users can click on a violation to see detailed logs.
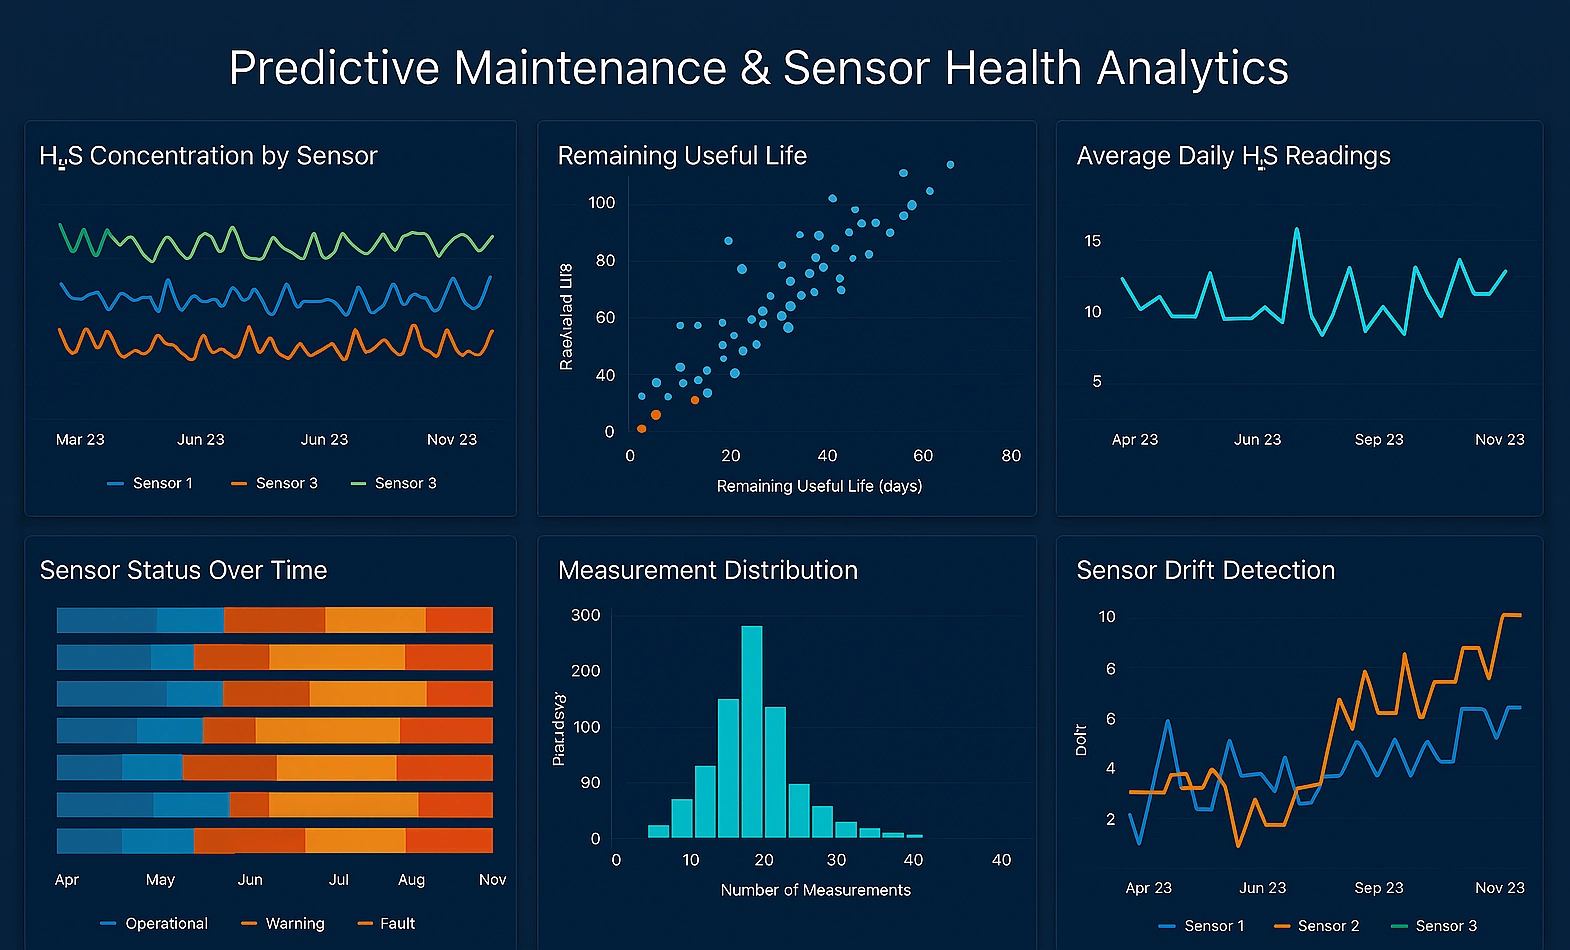
3. Predictive Maintenance & Sensor Health Analytics
H₂S sensors require regular calibration. This dashboard helps maintenance teams track sensor performance and predict failures.
Charts & Visualizations Used:
- Scatter Plots – Detect sensor drift by comparing readings against control sensors.
- Histograms – Analyze calibration frequency and failure rates.
- Status Indicators – Red/yellow/green icons show which sensors need servicing.
Analytics Features:
- Machine Learning Integration – Uses historical data to predict sensor degradation.
- Maintenance Scheduling – Recommends calibration timelines based on usage patterns.
4. Historical Trend Analysis
Long-term data helps identify patterns, such as seasonal H₂S spikes or recurring leaks.
Charts & Visualizations Used:
- Multi-Line Trend Graphs – Compare year-over-year gas levels.
- Box Plots – Show statistical distributions of exposure data.
- Correlation Matrices – Explore relationships between H₂S levels and external factors (e.g., temperature, production rates).
Analytics Features:
- Anomaly Detection – Flags unusual spikes for investigation.
- Forecasting – Predicts future exposure risks using ARIMA models.
Technical Implementation with StyleBI
Data Integration
- Source Systems: Sensor data is collected via IoT gateways and stored in SQL/NoSQL databases.
- ETL Processes: StyleBI's data blending capabilities merge real-time feeds with historical records.
Embedding Dashboards
- Single Sign-On (SSO) Integration – Users access dashboards via existing safety management portals.
- REST API Automation – Alerts are pushed to mobile devices when thresholds are breached.
Customization & Extensions
- Python/R Scripting – Advanced statistical models are integrated for predictive analytics.
- White-Labeling – Dashboards are branded with the manufacturer's logo and color scheme.