What Features of InetSoft's StyleBI Dashboard Application Are Tailored to CEOs?
InetSoft's StyleBI Dashboard Application offers features tailored to CEOs, focusing on high-level insights, ease of use, and strategic decision-making support. Here are the key features:
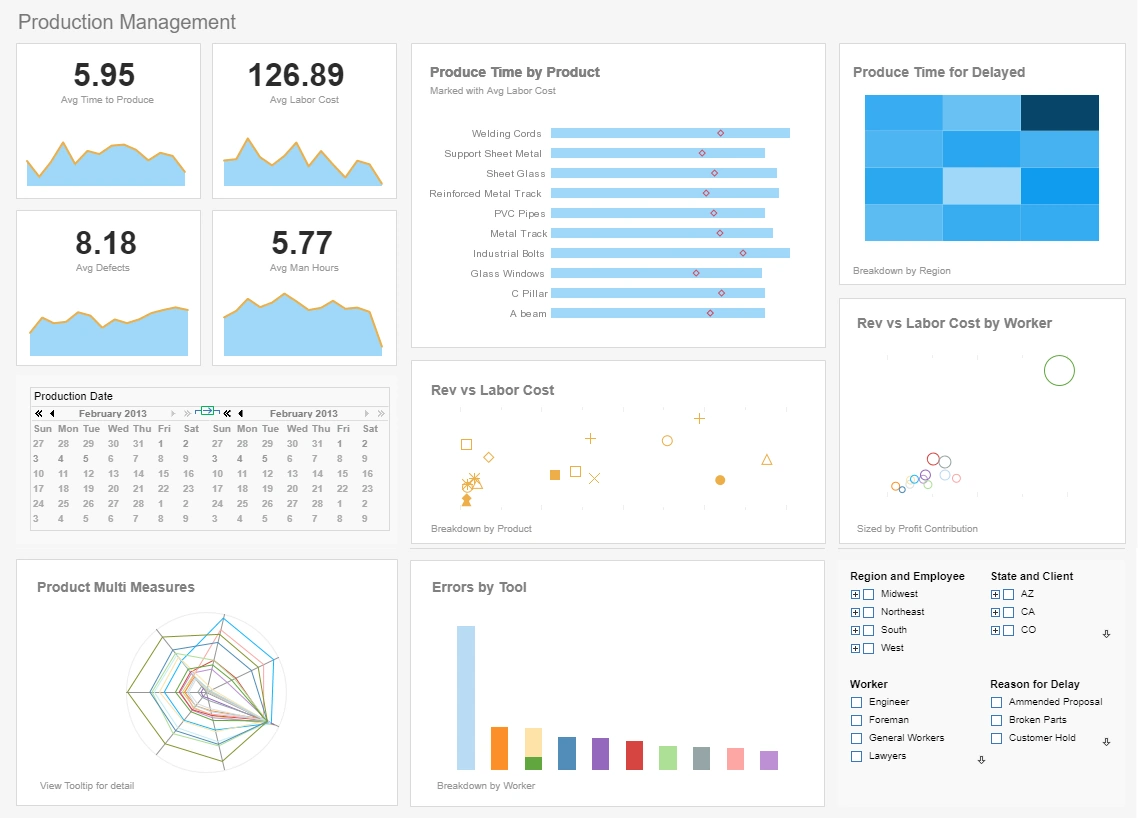
- Executive Dashboards: StyleBI provides pre-built, visually compelling dashboards displaying key performance indicators (KPIs) like revenue, profit margins, and operational metrics, enabling CEOs to monitor business health at a glance.
- Drag-and-Drop Interface: The intuitive, no-code designer allows CEOs or their teams to customize dashboards without IT expertise, ensuring quick access to relevant data visualizations.
- Real-Time Monitoring: Dashboards support real-time data updates, allowing CEOs to track critical metrics like sales performance or market trends instantly.
- Data Mashup Capabilities: StyleBI's Data Block™ technology enables CEOs to combine data from disparate sources (e.g., CRM, ERP, financial systems) into unified dashboards for a holistic view of the organization.
- Mobile Accessibility: Web-based, zero-client architecture ensures CEOs can access dashboards on any device, including smartphones, for on-the-go decision-making.
- Drill-Down Analytics: Interactive features allow CEOs to explore data deeply, moving from high-level summaries to detailed insights with simple clicks, aiding strategic analysis.
- Role-Based Security: Granular access controls ensure sensitive data is visible only to authorized users, protecting confidential metrics while allowing CEOs full visibility.
- Customizable Visualizations: CEOs can tailor charts, gauges, and heatmaps to focus on specific strategic goals, with options for branding to align with corporate identity.
- Predictive Insights: Trend analysis and forecasting tools help CEOs anticipate market shifts or operational challenges, supporting proactive decision-making.
- Self-Service Reporting: Ad hoc reporting empowers CEOs to generate custom reports without relying on IT, speeding up access to critical insights.

What Specific Features of InetSoft's Self-Service Reporting Does a CEO use?
InetSoft's StyleBI Dashboard Application's self-service reporting features empower CEOs to access, explore, and analyze data independently, aligning with their need for strategic insights without relying on IT. These features are designed for ease of use, flexibility, and high-level decision-making, enabling CEOs to focus on driving organizational success. Below is an elaboration on the specific self-service reporting features a CEO would use, tailored to their strategic and time-sensitive responsibilities.
The drag-and-drop report builder is a cornerstone feature for CEOs. With no coding required, CEOs can create custom reports by selecting data sources, metrics, and visualizations through an intuitive interface. For example, a CEO preparing for a board meeting can quickly build a report comparing quarterly revenue across regions, choosing bar charts or tables to highlight trends. This eliminates delays from IT bottlenecks, ensuring timely access to critical data.
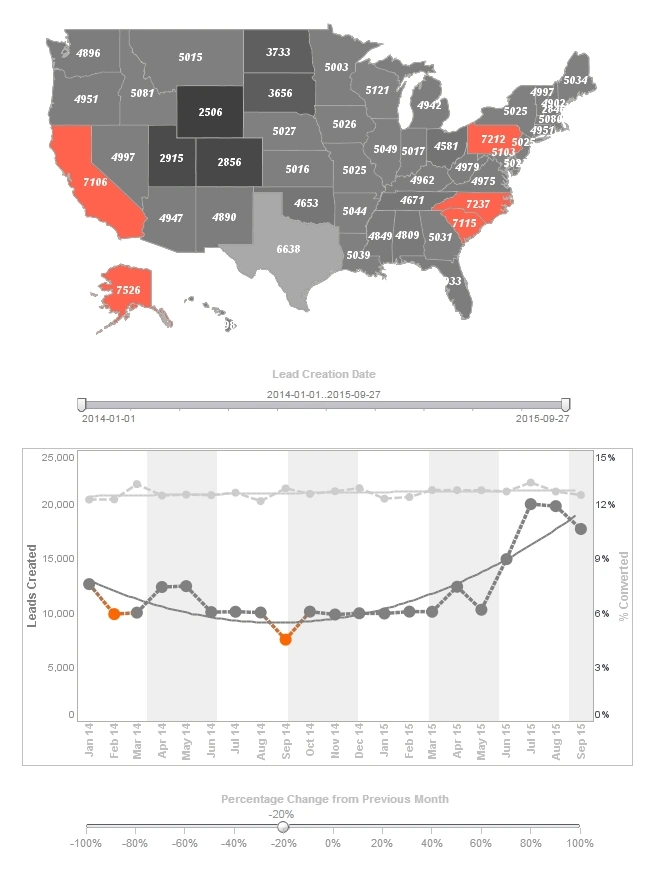
Ad hoc reporting allows CEOs to generate reports on the fly, addressing immediate strategic questions. Whether assessing the impact of a new product launch or evaluating marketing campaign ROI, CEOs can pull data from systems like Salesforce or SAP, filter by specific criteria (e.g., customer segment or time period), and view results instantly. This flexibility supports rapid decision-making, such as reallocating budgets or pivoting strategies during market shifts.
Interactive data exploration is another key feature. CEOs can use drill-down capabilities to move from high-level summaries to granular details. For instance, a CEO reviewing a profit margin report can click to uncover underperforming product lines or regions, identifying root causes like supply chain costs. Sorting, filtering, and grouping options further refine insights, enabling CEOs to focus on outliers or opportunities without needing pre-configured reports.
Multi-source data integration via InetSoft's Data Block™ technology is critical for CEOs overseeing diverse operations. They can combine data from financial systems, CRM platforms, and external sources like market analytics into a single report. A CEO might create a report blending sales data with competitor benchmarks to evaluate market share, providing a holistic view for strategic planning.
Pre-built templates and visual options cater to CEOs' need for polished, board-ready reports. StyleBI offers customizable templates for financial, operational, or customer metrics, with visualizations like heatmaps, gauges, or pie charts. A CEO can select a template to report on cash flow trends, adjust colors to match corporate branding, and export it as a PDF for stakeholder presentations, saving time while maintaining professionalism.
Mobile access ensures CEOs can use self-service reporting anywhere. The web-based platform allows report creation or viewing on smartphones, ideal for reviewing sales updates during travel or generating a last-minute report before an investor call.
Finally, role-based security ensures CEOs access sensitive data securely. They can generate reports on executive-only metrics, like M&A financials, without exposing data to unauthorized users, maintaining compliance and confidentiality.

More Articles About InetSoft's CEO Dashboard Application
Creating a Dashboard - Success in business is often derived from the ability to change quickly without a moment's notice. Using InetSoft's Style Intelligence, you can create custom dashboards that all you add and modify new information as it arises. In the competitive business environment of today, you can't afford not to have it. This section walks you through the creation of a simple Viewsheet. The exercise uses an existing Worksheet called ‘ProductSales’, which is included in the default installation. It is based on the sample ‘Orders’ data source. To create this Viewsheet, follow the steps below: 1. Launch the Visual Composer from the Portal. (Select the Design tab and then the ‘Visual Composer’ option.) 2. Click on the ‘New Viewsheet’ button. The ‘Select a Worksheet’ dialog box will open. Expand ‘Global Worksheet’ and the ‘Tutorial’ folder. Select the ‘ProductSales’ Worksheet. Click ‘OK’. 3. Drag the ‘SalesByDate’ Data Block from the left pane into the grid. This creates a Table containing the Data Block’s columns. 4. Expand the ‘SalesByDate’ node to show the list of fields within that Data Block. 5. Click and drag the ‘State’ field to an empty cell in the grid. This creates a Selection List that will let you choose the states to include...
Creating a Dashboard Column - Creating a dashboard column that presents data in a simple and concise way is easier than ever before using InetSoft's award-winning dashboard software. A numeric range column groups numeric data into a predefined set of bins or ranges. You can create a range column for any numeric column in a Data Table. To create a range column, follow these steps: 1. Right-click the header of the column for which you want to create a range column, and select the 'New Range Column' option from the context menu. This opens the 'Value Range Name' dialog box 2. Enter a name for the new range column, and click 'OK'. This opens the 'Numeric Range Option' dialog box. Here you can specify the different benchmarks defining the range. To customize a bench¬mark label, double-click the benchmark value. to enable editing. 3. Enter a benchmark value into the 'Value Range' field, and click the 'Add' button. Repeat until all desired benchmarks have been entered...
Creating a Dashboard Table - Using InetSoft's dashboard software makes it easy to create a dashboard table that will communicate multi-dimensional data in a simple and concise way. You can combine data from multiple queries and different data sources into a Data Table, producing a single dataset that contains meaningful and useful information. Tables have many different roles. Many Data Table operations create and maintain links between the component Data Tables, conditions, expressions, etc. These links are displayed graphically by dashed lines connecting the assets. When the configuration or value of a linked asset is changed, the impact of the change propagates to all its dependent components. This dynamic data updating makes it easy to explore the data and to perform cause and effect analysis. To create a regular Data Table from a query or data model, drag one of the following assets from the Asset Repository tree into the Worksheet...
Creating a Portlet Dashboard - Users can easily create a portlet dashboard using StyleBI - InetSoft's comprehensive real-time analytical reporting and dashboard software solution. A portlet dashboard can contain a combination of report and viewsheet elements in a particular row or column layout. To create a portlet dashboard, follow these steps: 1. Under the Design tab, click the 'Dashboard' button. 2. Click the 'New Dashboard' button under the 'Dashboards' table. This opens the 'Dashboard Properties' dialog box. 3. In the 'Dashboard Name' field, enter a name for the new dashboard. This name will be displayed on this dashboard's tab in the Portal. 4. Select 'Portlet Dashboard' as the 'Dashboard Type'. 5. From the 'Layout' menu, select the desired arrangement of row/column portlet containers. A column container permits its constituent portlets to be positioned vertically, while a row container permits its constituent portlets to be positioned horizontally. The row/column layout of a dashboard cannot be changed after it is specified...