Web 2.0 Dashboards
Searching for information about Web 2.0 dashboards? InetSoft's HTML5-based dashboarding software is highly interactive and easy enough to use that business users can explore much data on their own. View a demo.
Creating a Viewsheet Dashboard - Creating a viewsheet dashboard is a simple and intuitive process with InetSoft's comprehensive real-time analytical reporting and dashboard software solution. A viewsheet dashboard consists of a single viewsheet. This top-level viewsheet can be designed to contain multiple nested viewsheets that present a variety of different information. To create a viewsheet dashboard, follow these steps: 1. Under the Design tab, click the 'Dashboard' button. 2. Click the 'New Dashboard' button under the 'Dashboards' table. This opens the 'Dashboard Properties' dialog box. 3. In the 'Dashboard Name' field, enter a name for the new dashboard. This name will be displayed on the dashboard's tab in the Portal. 4. (Optional) Enter a description for the dashboard in the 'Description' field. This description is only visible when the dashboard is being edited...
Creating Dashboard Lists - Creating dashboard lists with InetSoft's Data Block Technology is a simple process that allows users to assemble information in an intuitive manner. Selection Lists and Selection Trees have the unique property that they are simultaneously both input elements and output elements. When two or more Selection Lists or trees are linked to the same Data Block in a Worksheet, the inputs to one of the lists or trees will modify the display in the other trees. See the example This section explains how to make and clear selections, and explains the meaning of the Selection List symbols. The following sections explain how to submit, clear, and reverse a selection. To submit a selection, follow these steps: 1. Check the desired options in the Selection List or tree. 2. Hover the mouse over the list or tree to make the top-right toolbar visible. 3. Click the ‘Apply’ button...
Creating Portlet Dashboards - InetSoft's sophisticated dashboard software allows users to create portlet dashboards that have the look and feel of a modern simple-to-use webpage. A Portlet Dashboard may contain a combination of report and Viewsheet elements in a particular row or column layout. To create a Portlet Dashboard, follow these steps: 1. Open the 'Dashboard Configuration' page (under the Server tab, in 'Presentation' > 'Dashboard'). 2. Click the 'New Dashboard' button under the 'Dashboards' table. This opens the 'Dashboard Properties' dialog box. 3. In the 'Dashboard Name' field, enter a name for the new dashboard. This name will be displayed on this dashboard's tab in the User Portal...
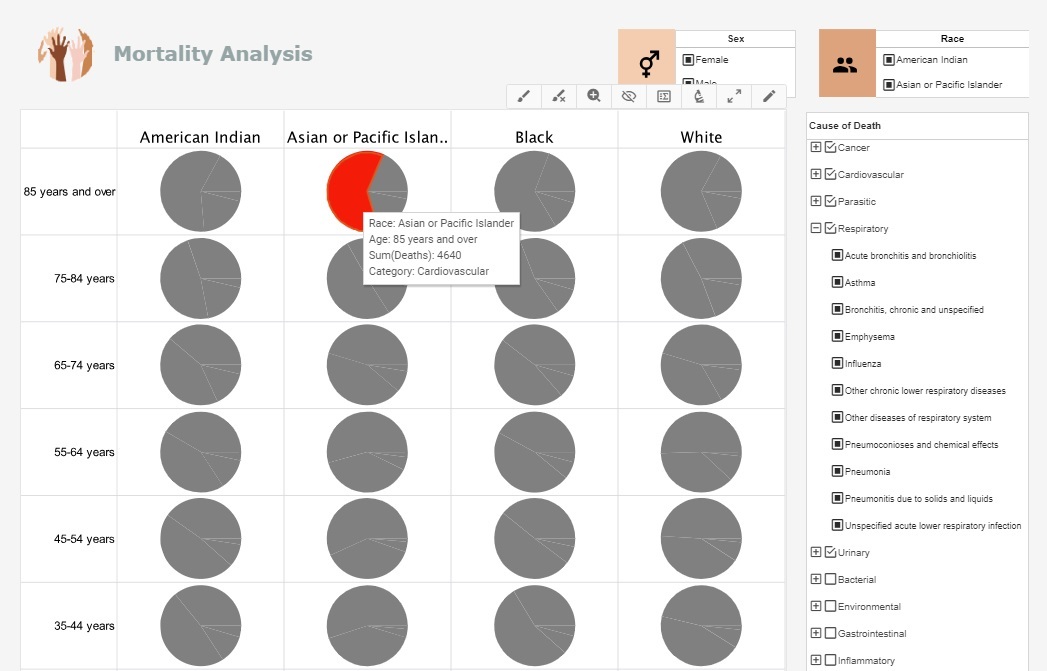
Creating Real-time Dashboards and Visualizations - I am going to show you the features today of our BI application called Style Intelligence. I am going to start up with the visualization module, show you some sample dashboards. In the InetSoft world, these interactive exploratory dashboards are called viewsheets. I can show you some finished viewsheets, and let's see how these are developed using a drag and drop Web interface. Then we will look at the publishing module. We will look at some sample reports. And then we can look at something called ad hoc reporting, where again a business user can modify an existing report using Web-based tools and even create new reports from scratch. Then we will look at the foundation and how you set it all up, how you connect your different data sources, how you logically model them, extract data out, and how you partition it. Well what do I have in front of me? In front of me, I have our default user portal. So when you install the product, we give you an out-of-the-box framework via which users can log in. They can view their dashboards, view their reports. They can self-serve themselves. They can design their own dashboards and reports. They can set up batch jobs. They can schedule reports. Run this everyday at 6 o’clock, and email it out to my boss...

Creating Viewsheet Dashboards - InetSoft's dashboard software is setup for users to create viewsheet dashboards, a simple process that can be used to form sophisticated dashboards in a matter of minutes. A Viewsheet Dashboard consists of a single Viewsheet. This top-level Viewsheet can contain multiple nested Viewsheets that present the desired information to the user. To create a Viewsheet Dashboard, follow these steps: 1. Open the 'Dashboard Configuration' page (under the Server tab in 'Presentation' > 'Dashboard'). 2. Click the 'New Dashboard' button under the 'Dashboards' table. This opens the 'Dashboard Properties' dialog box. 3. In the 'Dashboard Name' field, enter a name for the new dashboard. This name will be displayed on this dashboard's tab in the User Portal. 4. (Optional) Enter a description for the dashboard in the 'Description' field. This description is visible when the dashboard is being edited by administrator or user...
Credit Union Managers Use Dashboards - Credit union managers have a variety of tasks that are part of their job description. Some of those tasks include financial reporting, training, and onboarding staff, as well as marketing and sales. Everything they do has to be data-driven and even their marketing and sales approach should include data-backed storytelling. The vast majority of the data needed by credit union managers was handled using Excel sheets and other traditional software. Lately, this has changed and a lot of managers started focusing on using dashboards. What was behind this change of heart? Here are the reasons...
Crisis Management KPI Dashboards - Including anything from severe weather events to public health crises to cyberattacks and economic downturns. For an organization to minimize harm, ensure the safety of its stakeholders, and maintain its reputation, crisis management must be done effectively. Dashboards for crisis management have become effective tools for tracking, evaluating, and reacting to crises in real time. These dashboards' Key Performance Indicators (KPIs) are essential for helping firms gauge the severity of a crisis, monitor response activities, and make defensible judgments. This article examines the critical KPIs used on crisis management dashboards to effectively traverse challenging situations. KPIs that assess the situation's severity are at the center of any crisis management dashboard. These indicators aid companies in comprehending the crisis' possible effects on their activities, reputation, and stakeholders. Measures like "Magnitude of Impact" place a number on how big the issue is, whether it's a natural catastrophe or a hit to one's image. For emergencies that have the potential to grow quickly, like infectious disease outbreaks or cyberattacks, "Rate of Spread" KPIs are essential. Organizations may spend resources efficiently and put responsive plans into place by monitoring these KPIs...

Crucial KPI Dashboards - The way that firms can utilize and learn from the vast amounts of data about their company and consumers is changing thanks to business intelligence (BI) software and solutions. The KPI dashboard is one of the most helpful tools businesses can use to visualize the performance of many different parts of their organization...