What Are the Metrics Tracked on a Chocolatier’s Dashboards?
A well-designed sales dashboard shows how effectively products are reaching customers and generating revenue, while a supply chain dashboard reveals how efficiently ingredients and finished goods move from bean to bar to box. Together, they help balance artistry, quality, and profitability.


Key Metrics on a Chocolatier’s Supply Chain Dashboard
1. Inventory Levels and Days of Stock
What it is: Current quantities of raw materials (cocoa beans, cocoa butter, sugar, milk powder, nuts, flavorings) and finished goods, plus how many days they will last at current sales rates.
What it means: Too much inventory ties up cash and risks spoilage, especially for fresh fillings. Too little inventory leads to stockouts and lost sales, particularly during holidays.
How to affect it: Use demand forecasting based on historical sales, set minimum and maximum stock thresholds, and adjust order frequency with suppliers. For perishable items, shorten production runs and increase replenishment frequency.
2. Lead Time for Raw Materials
What it is: The time between placing an order for ingredients and receiving them in usable condition.
What it means: Long or unpredictable lead times can disrupt production schedules and cause stockouts of key products. This is especially critical for specialty cocoa, single-origin beans, or rare inclusions.
How to affect it: Build strong relationships with suppliers, negotiate service-level agreements, diversify suppliers for critical ingredients, and maintain safety stock for items with long lead times.

3. Production Yield and Scrap Rate
What it is: Yield measures the percentage of usable product produced from raw materials. Scrap rate tracks waste due to defects, breakage, or quality issues.
What it means: Low yield or high scrap indicates process inefficiencies, equipment problems, or inconsistent techniques (e.g., poor tempering, incorrect cooling, or packaging damage).
How to affect it: Standardize recipes and processes, train staff on tempering and molding, maintain equipment, and monitor temperature and humidity. Analyze where defects occur and adjust process steps or tools.
4. On-Time Production and Order Fulfillment
What it is: The percentage of orders produced and shipped by the promised date, both for retail replenishment and wholesale or corporate orders.
What it means: High on-time performance builds trust with retailers and corporate clients and prevents last-minute rushes that can compromise quality.
How to affect it: Improve production scheduling, align capacity with seasonal peaks, and create clear cut-off dates for custom or large orders. Use buffer time for complex assortments and ensure packaging materials are always available.
5. Cold Chain and Storage Conditions
What it is: Temperature and humidity metrics in storage rooms, production areas, and during transport (especially for delicate fillings and pralines).
What it means: Chocolate is sensitive to heat and moisture. Poor conditions cause bloom, texture changes, and flavor degradation, leading to returns, waste, and brand damage.
How to affect it: Use calibrated sensors and alerts, maintain HVAC and refrigeration systems, and set clear handling procedures for staff and logistics partners. Regularly audit storage conditions and packaging integrity.

6. Supplier Performance and Quality Metrics
What it is: On-time delivery rate, defect rate (e.g., foreign matter, off-flavors), and specification compliance for each supplier.
What it means: Reliable suppliers reduce disruptions and quality issues. Poor performance can cascade into production delays, rework, and customer complaints.
How to affect it: Score suppliers regularly, share performance feedback, and reward high performers with more volume. For underperformers, collaborate on corrective actions or gradually shift volume to more reliable partners.
7. Logistics Costs and Delivery Performance
What it is: Transportation costs per shipment, per kilogram, or as a percentage of sales, along with on-time delivery rates to stores, distributors, and end customers.
What it means: High logistics costs erode margins, while poor delivery performance damages customer experience and can ruin temperature-sensitive products.
How to affect it: Consolidate shipments where possible, negotiate rates with carriers, optimize delivery routes, and choose packaging that protects product without excessive weight. Track carrier performance and switch providers if service is consistently poor.
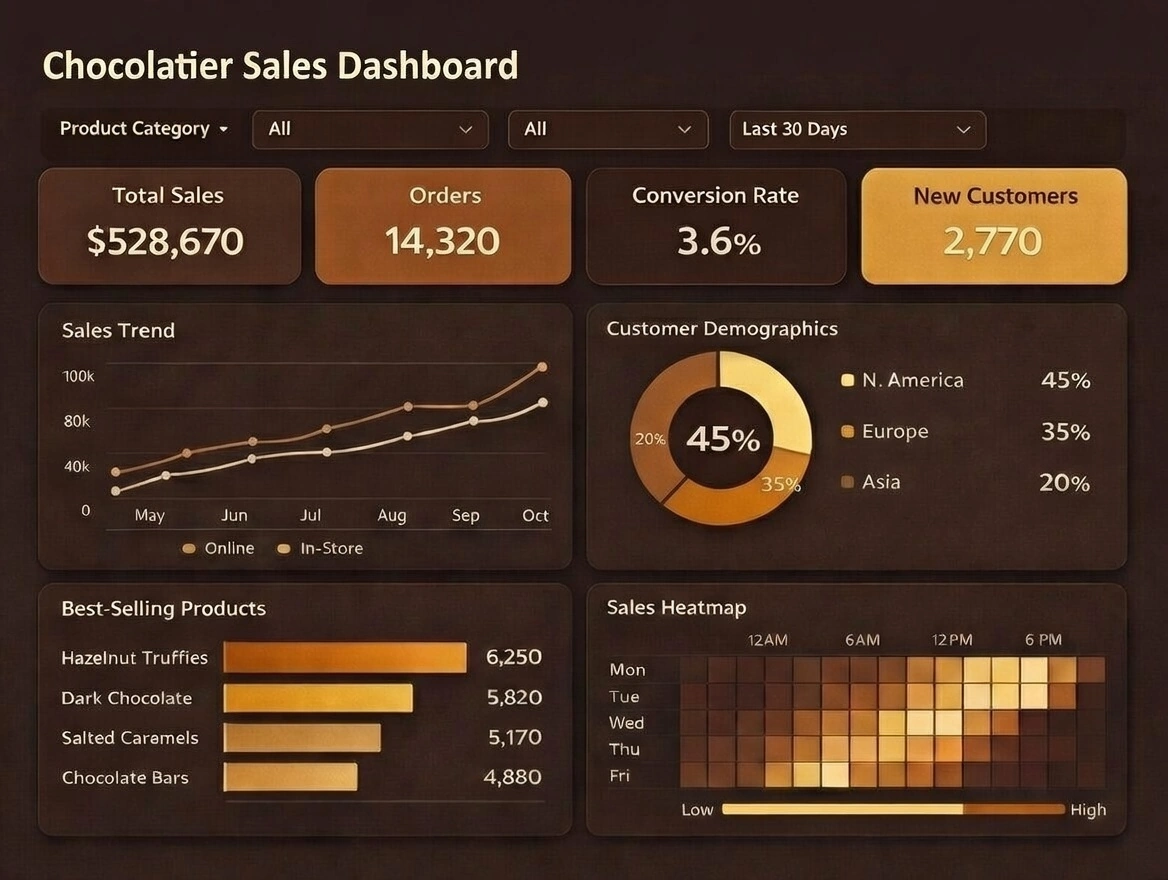
Key Metrics on a Chocolatier’s Sales Dashboard
1. Total Sales Revenue
What it is: The total value of chocolate products sold over a period (day, week, month, season). It can be tracked overall and by channel (retail shop, e-commerce, wholesale, corporate gifting).
What it means: Revenue shows the top-line health of the business. Spikes may align with holidays like Valentine’s Day, Easter, and Christmas, while dips may reveal off-season periods or marketing gaps.
How to affect it: Introduce seasonal collections, bundle products (e.g., assorted boxes), run targeted promotions, optimize pricing, and improve product photography and descriptions online. Expanding into corporate gifting or subscription boxes can also lift revenue.
2. Units Sold by Product and Category
What it is: The number of units sold for each SKU (e.g., dark chocolate bar, truffle box, hot chocolate mix) and broader categories (bars, truffles, pralines, seasonal items).
What it means: This reveals bestsellers and underperformers. It helps identify which flavors, formats, and price points resonate with customers and which may need reformulation, rebranding, or discontinuation.
How to affect it: Promote high-margin bestsellers more prominently in-store and online, adjust shelf placement, feature them in email campaigns, and consider limited-edition variants. For slow movers, test new packaging, smaller sizes, or bundling with popular items.

3. Average Order Value (AOV)
What it is: The average amount a customer spends per transaction.
What it means: A higher AOV usually indicates effective upselling and cross-selling. For a chocolatier, it often reflects how well staff or the website encourages customers to add extra items like gift wrapping, greeting cards, or complementary products (e.g., hot chocolate with truffles).
How to affect it: Offer tiered discounts (“Spend $50, get 10% off”), curated gift sets, add-on suggestions at checkout, and volume-based pricing for corporate or event orders. In-store, train staff to suggest pairings and upgrades.
4. Sales by Channel (Retail, Online, Wholesale, Corporate)
What it is: Revenue and units sold broken down by sales channel.
What it means: This shows where growth is coming from and where the chocolatier is vulnerable. For example, heavy reliance on a single wholesale client is risky, while a balanced mix of retail, online, and corporate sales is more resilient.
How to affect it: Invest in underperforming but strategic channels (e.g., improve the e-commerce experience, partner with local cafes, or build a corporate gifting program). Tailor product assortments and pricing to each channel’s needs.

5. Customer Metrics: New vs. Returning Customers
What it is: The proportion of first-time buyers versus repeat customers, often tracked by channel.
What it means: A strong chocolatier brand thrives on loyalty. High repeat purchase rates suggest excellent product quality and customer experience, while low retention may indicate issues with taste, packaging, or service.
How to affect it: Implement loyalty programs, offer exclusive flavors to repeat customers, collect feedback, and ensure consistent quality. Follow up online purchases with thank-you emails and personalized recommendations.
6. Seasonal and Holiday Performance
What it is: Sales metrics segmented by key holidays and seasons.
What it means: Chocolatiers are highly seasonal. Understanding which holidays drive the most revenue helps with production planning, staffing, and marketing timing.
How to affect it: Launch holiday collections early, pre-sell limited editions, and coordinate campaigns across email, social media, and in-store displays. Use past data to forecast demand and avoid stockouts or overproduction.
Bringing Sales and Supply Chain Dashboards Together
The real power comes when the chocolatier connects sales and supply chain metrics. Sales forecasts inform production and purchasing; inventory and lead times shape promotional calendars; quality and yield influence pricing and margins. By watching both dashboards side by side, a chocolatier can ensure that every bar, truffle, and gift box not only delights customers but also supports a healthy, sustainable business.

Additional Reading Resources
1. Cocoa Supply Chain Insights – International Cocoa Organization (ICCO)
The ICCO provides authoritative data on cocoa production, pricing, sustainability, and global supply chain dynamics. Chocolatiers can use these insights to understand ingredient cost drivers and sourcing risks. It’s especially valuable for forecasting raw material volatility and planning procurement strategies.
2. Specialty Food Association – Chocolate Market Trends
The Specialty Food Association publishes trend reports on premium chocolate, consumer preferences, and flavor innovation. These insights help chocolatiers align product development with evolving market demand. It’s a strong resource for understanding seasonal patterns and premiumization trends.
3. Food Logistics – Cold Chain and Confectionery Handling
Food Logistics covers best practices in temperature‑controlled storage, transportation, and packaging. Chocolatiers benefit from guidance on preventing bloom, maintaining product integrity, and optimizing last‑mile delivery. It’s particularly useful for improving supply chain KPIs related to freshness and spoilage.
4. National Confectioners Association – Industry Data & Research
The NCA provides market research, sales statistics, and consumer behavior insights for the confectionery industry. Chocolatiers can benchmark performance, identify growth opportunities, and understand category‑level trends. Their reports support strategic planning across sales, marketing, and supply chain operations.

Industry Dashboard Articles on InetSoft.com
Healthcare Analytics Dashboard
This article explores how healthcare providers use dashboards to monitor patient flow, treatment outcomes, staffing efficiency, and operational KPIs. It explains how visual analytics help reduce bottlenecks, improve care quality, and support data‑driven decision‑making across clinical and administrative teams.
Manufacturing Operations Dashboard
A deep dive into dashboards designed for production environments, covering metrics such as machine uptime, throughput, scrap rate, cycle time, and quality control indicators. The article highlights how manufacturers use real‑time monitoring to optimize efficiency and reduce operational costs.
Retail Sales Performance Dashboard
This piece explains how retailers track sales trends, product performance, customer behavior, and store‑level KPIs. It shows how dashboards support inventory planning, promotional strategy, and omnichannel performance analysis.
Logistics & Supply Chain Dashboard
An overview of dashboards used in logistics and distribution, focusing on delivery performance, transportation cost, warehouse efficiency, and inventory movement. The article demonstrates how visual analytics improve supply chain visibility and reduce delays.