Dashboard Performance Optimization
Slow dashboards kill adoption. Users expect analytics to feel instant, even when queries touch large datasets and complex calculations. Effective dashboard performance optimization combines caching, query tuning, dataset modeling, and layout strategies to deliver fast, reliable BI experiences at scale.
This article walks through the core techniques you can use to improve dashboard responsiveness, reduce load times, and keep performance predictable as data and user counts grow.
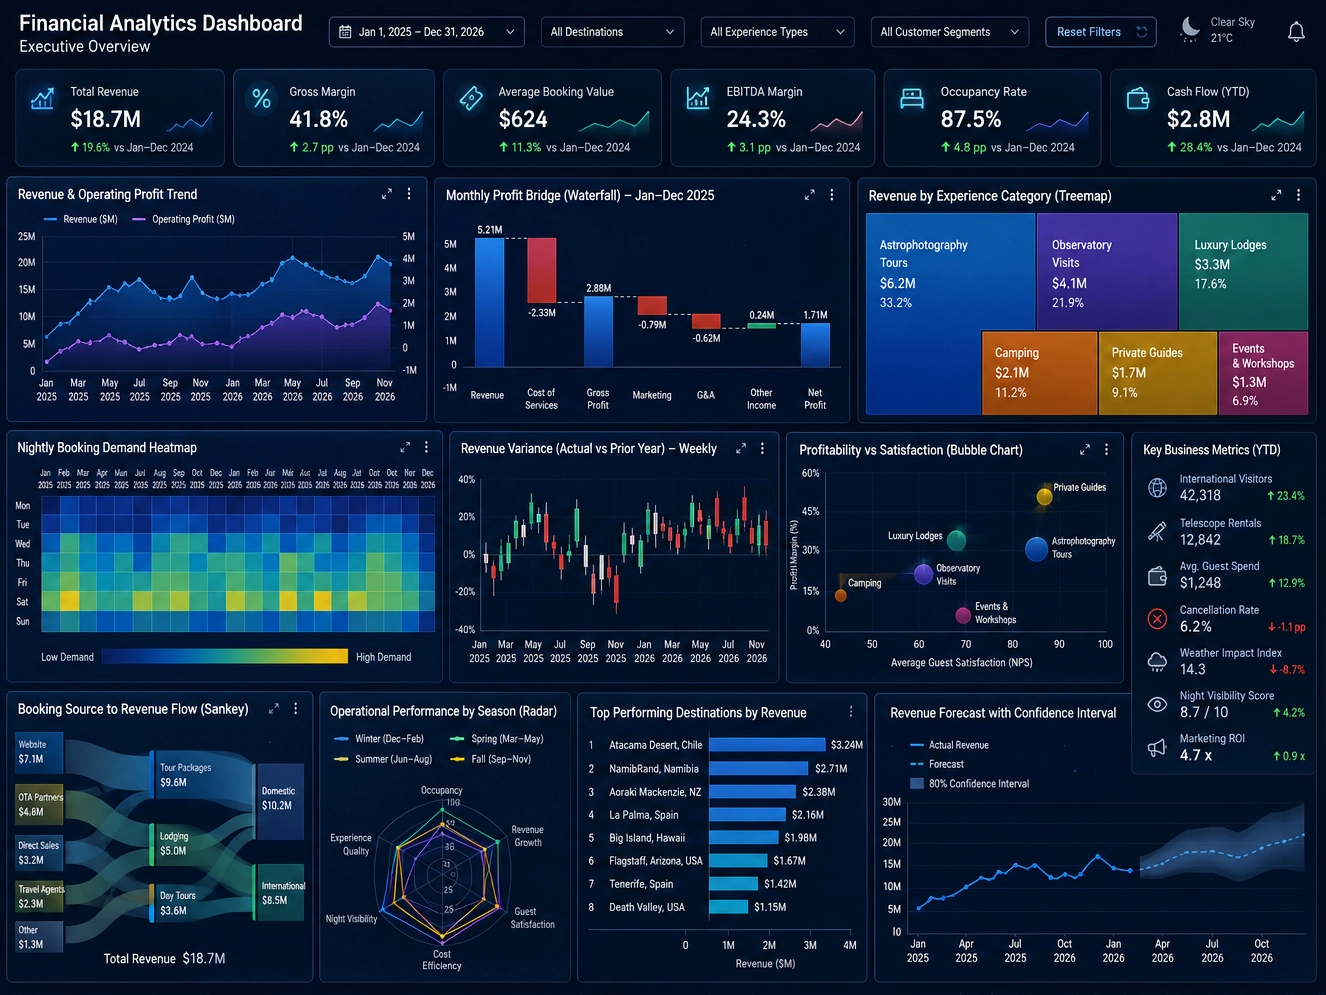
Caching Strategies for Faster Dashboards
Caching is often the single biggest lever for improving dashboard performance. By storing precomputed results, you avoid repeatedly running expensive queries and calculations every time a user opens a dashboard.
Types of Caching
- Result caching: Store the final query results for reuse across users and sessions.
- Aggregate caching: Cache pre-aggregated metrics (totals, averages, counts) for common time periods.
- In-memory caching: Keep frequently accessed datasets in memory for faster reads.
- Application-level caching: Cache rendered dashboard components or API responses.
Caching Best Practices
- Align cache TTLs with data freshness: Shorter TTLs for real-time data, longer for static reference data.
- Cache at the right layer: Database, BI server, or application depending on architecture.
- Invalidate intelligently: Clear caches when source data changes, not on every request.
- Monitor hit rates: Track cache effectiveness and adjust strategies based on usage patterns.
Query Tuning for High-Performance Dashboards
Even with caching, poorly written queries can slow dashboards down. Query tuning focuses on optimizing how data is retrieved from underlying systems so that dashboards respond quickly under load.
Core Query Optimization Techniques
- Indexing: Ensure key filter, join, and sort columns are indexed appropriately.
- Selective filtering: Reduce result sets with targeted WHERE clauses and date ranges.
- Avoiding unnecessary joins: Remove joins that do not contribute to visible metrics or dimensions.
- Using appropriate aggregations: Aggregate data in the database rather than in the BI tool when possible.
Operational Query Tuning Practices
- Analyze query plans: Review execution plans to identify bottlenecks and missing indexes.
- Limit heavy queries: Restrict or schedule resource-intensive queries to off-peak times.
- Parameterize queries: Use parameters to reuse query structures and improve caching.
- Test under load: Validate performance with realistic concurrency and data volumes.
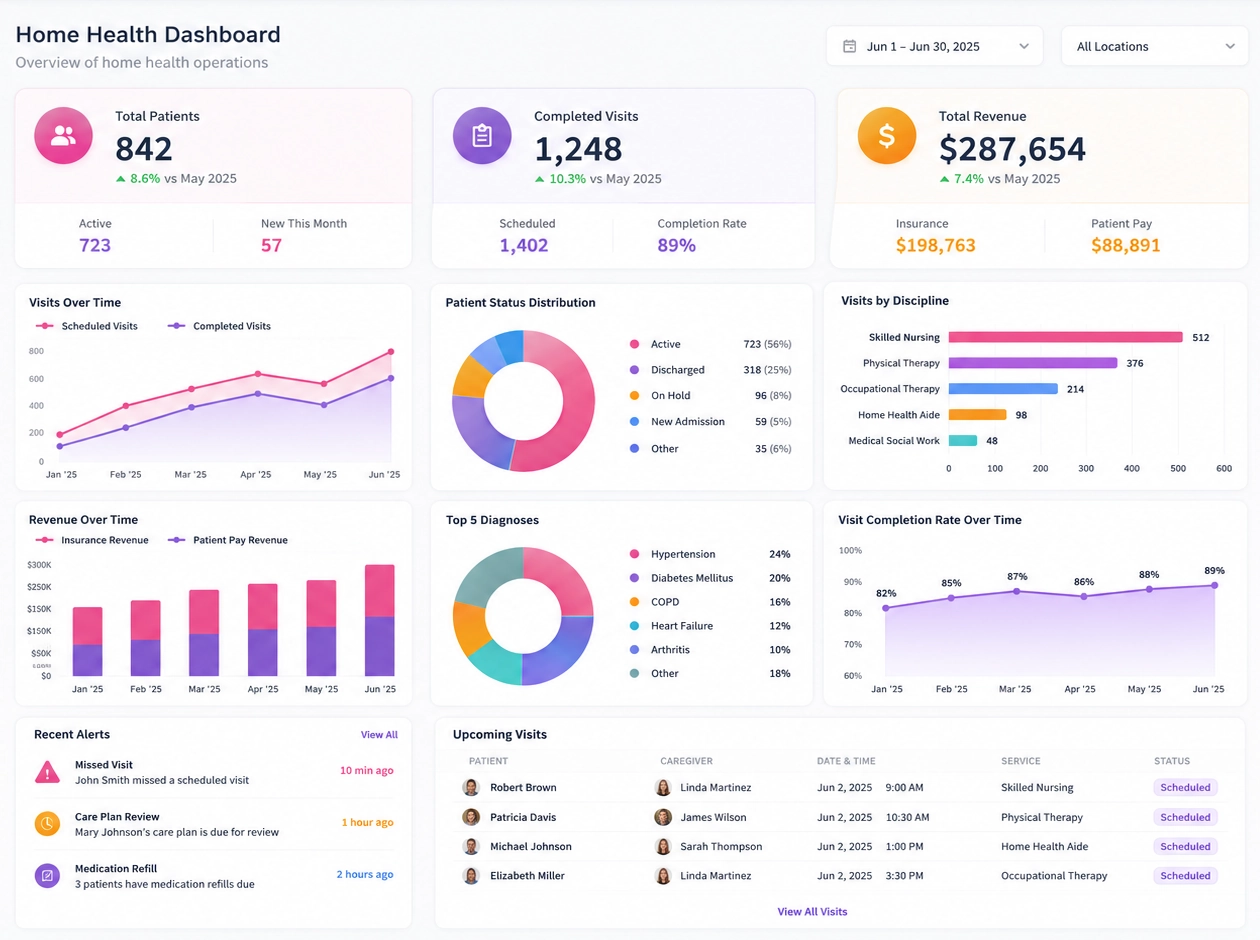
Dataset Modeling for Performance and Flexibility
Dataset modeling determines how data is structured and exposed to dashboards. A well-designed model reduces complexity, improves query performance, and makes it easier for users to build responsive visualizations.
Designing Efficient Datasets
- Use star or snowflake schemas: Separate facts and dimensions for cleaner joins and faster queries.
- Pre-aggregate where appropriate: Create summary tables for common reporting levels.
- Limit wide tables: Avoid exposing unnecessary columns that increase data transfer and processing.
- Normalize reference data: Keep lookup tables small and well-indexed.
Modeling for User Experience
- Align datasets with business questions: Group fields around real use cases, not just source systems.
- Provide curated semantic layers: Use business-friendly names and hide technical fields.
- Segment datasets by audience: Different models for executives, analysts, and operational users.
- Version and document models: Keep track of changes and provide clear guidance for builders.
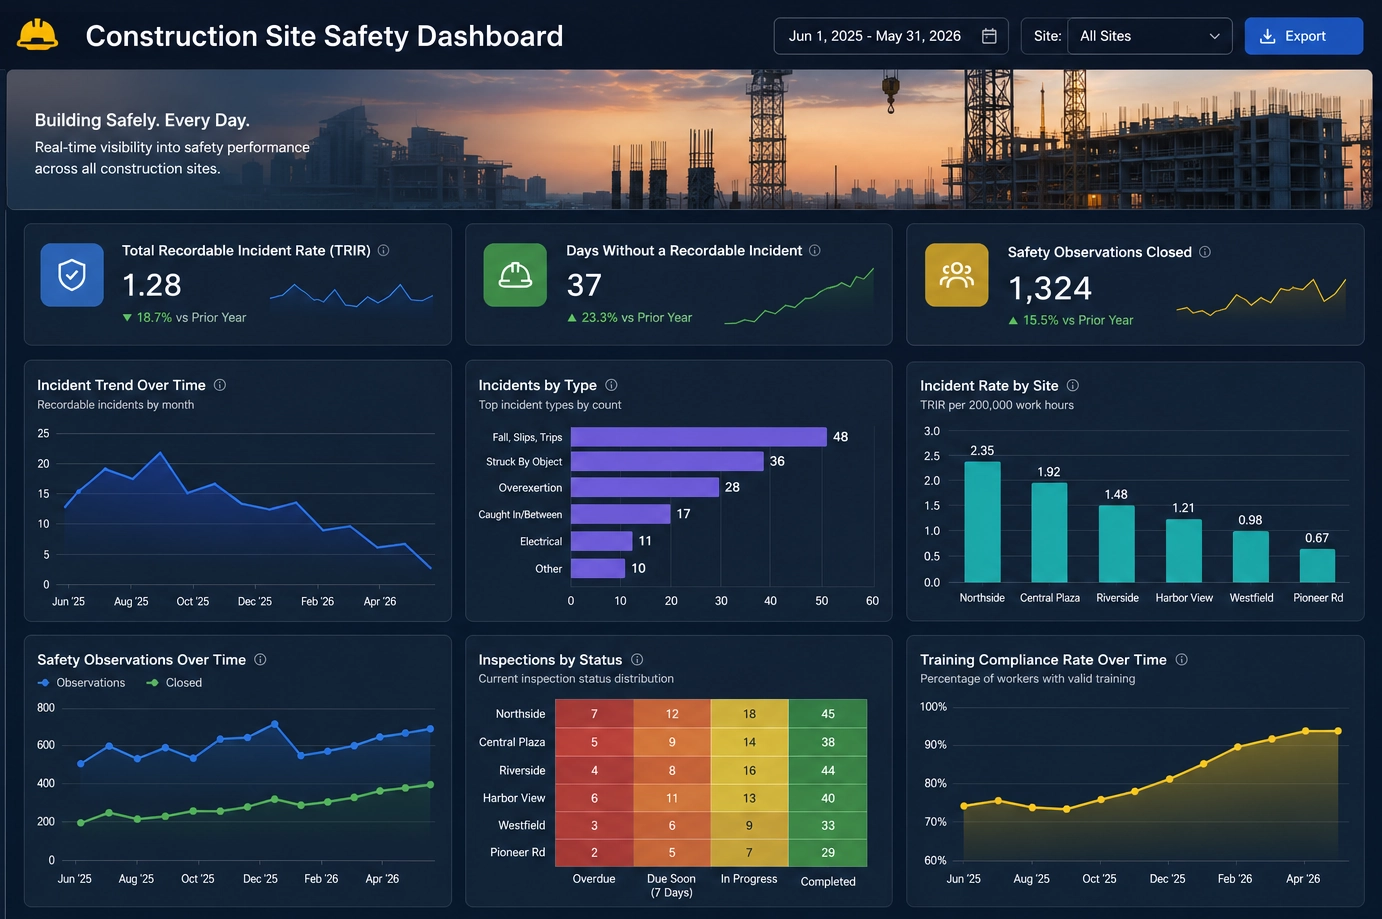
Layout Strategies for Responsive Dashboards
Layout decisions directly impact perceived performance. Even when queries are fast, cluttered or inefficient layouts can make dashboards feel slow and overwhelming. Smart layout strategies prioritize what users see first and reduce unnecessary rendering work.
Designing for Speed
- Prioritize above-the-fold content: Place key KPIs and visuals at the top for instant insight.
- Limit initial visual count: Avoid loading too many charts on first view; use tabs or drilldowns.
- Use progressive loading: Load critical components first, secondary details later.
- Optimize visual types: Choose charts that render quickly and clearly for the data size.
Usability and Performance Together
- Group related metrics: Reduce cognitive load and repeated queries by clustering related visuals.
- Avoid redundant visuals: Remove charts that duplicate information without adding value.
- Use filters thoughtfully: Provide focused filters that do not trigger unnecessary full-page reloads.
- Design for devices: Ensure layouts perform well on both desktop and mobile screens.
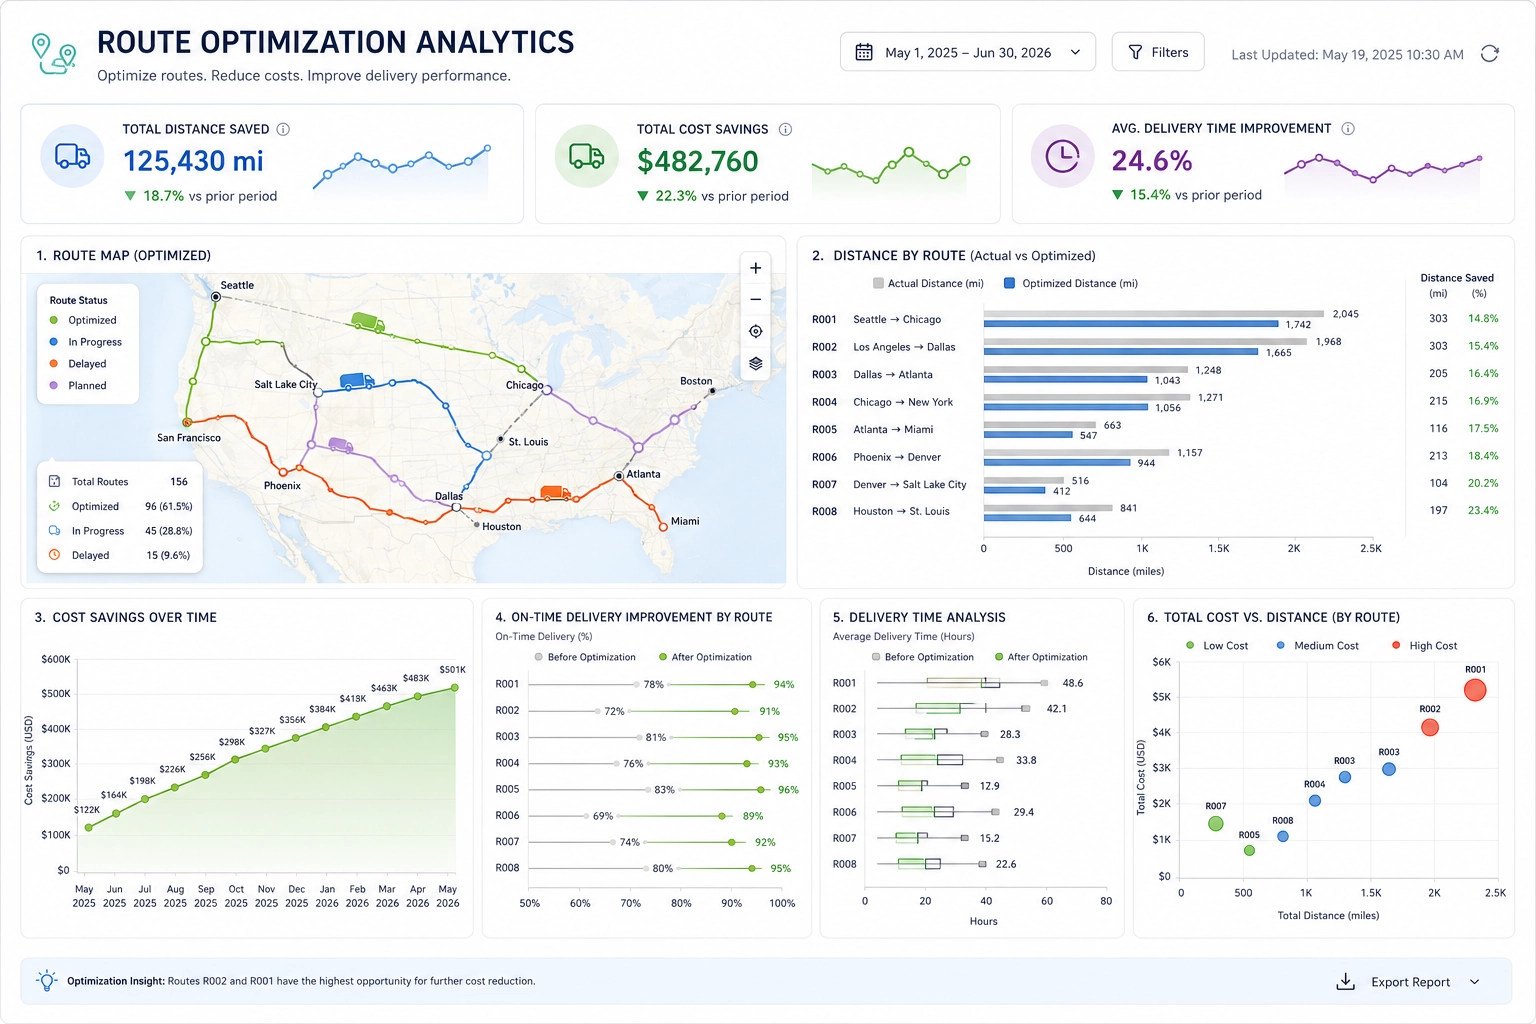
Monitoring and Continuous Optimization
Dashboard performance optimization is not a one-time project. As data grows and usage patterns change, you need ongoing monitoring and tuning to keep experiences fast and reliable.
- Track load times: Measure dashboard open times and interaction latency.
- Monitor resource usage: Watch CPU, memory, and database utilization under real workloads.
- Identify slow dashboards: Use performance reports to find and prioritize problem areas.
- Iterate with users: Gather feedback on perceived performance and adjust caching, queries, and layouts accordingly.
By combining caching, query tuning, dataset modeling, and layout strategies, you can build dashboards that feel fast, scale with demand, and earn long-term trust from business users.