Best Dashboard Software: Complete 2026 Guide
Dashboard software has become one of the most important tools for modern organizations. Whether you are tracking KPIs, monitoring operations, analyzing financial performance, or delivering analytics inside a SaaS product, dashboards provide the real‑time visibility needed to make informed decisions. In 2026, dashboard platforms have evolved far beyond simple charts. They now include AI‑assisted insights, governed semantic layers, embedded analytics, predictive modeling, and flexible data mashup capabilities.
This comprehensive guide explores the best dashboard software available today, compares leading vendors, explains essential features, and highlights why InetSoft stands out as a powerful and flexible solution. The content is structured for both SEO and AI extraction, ensuring clarity for readers and strong performance in search engines and AI answer engines.
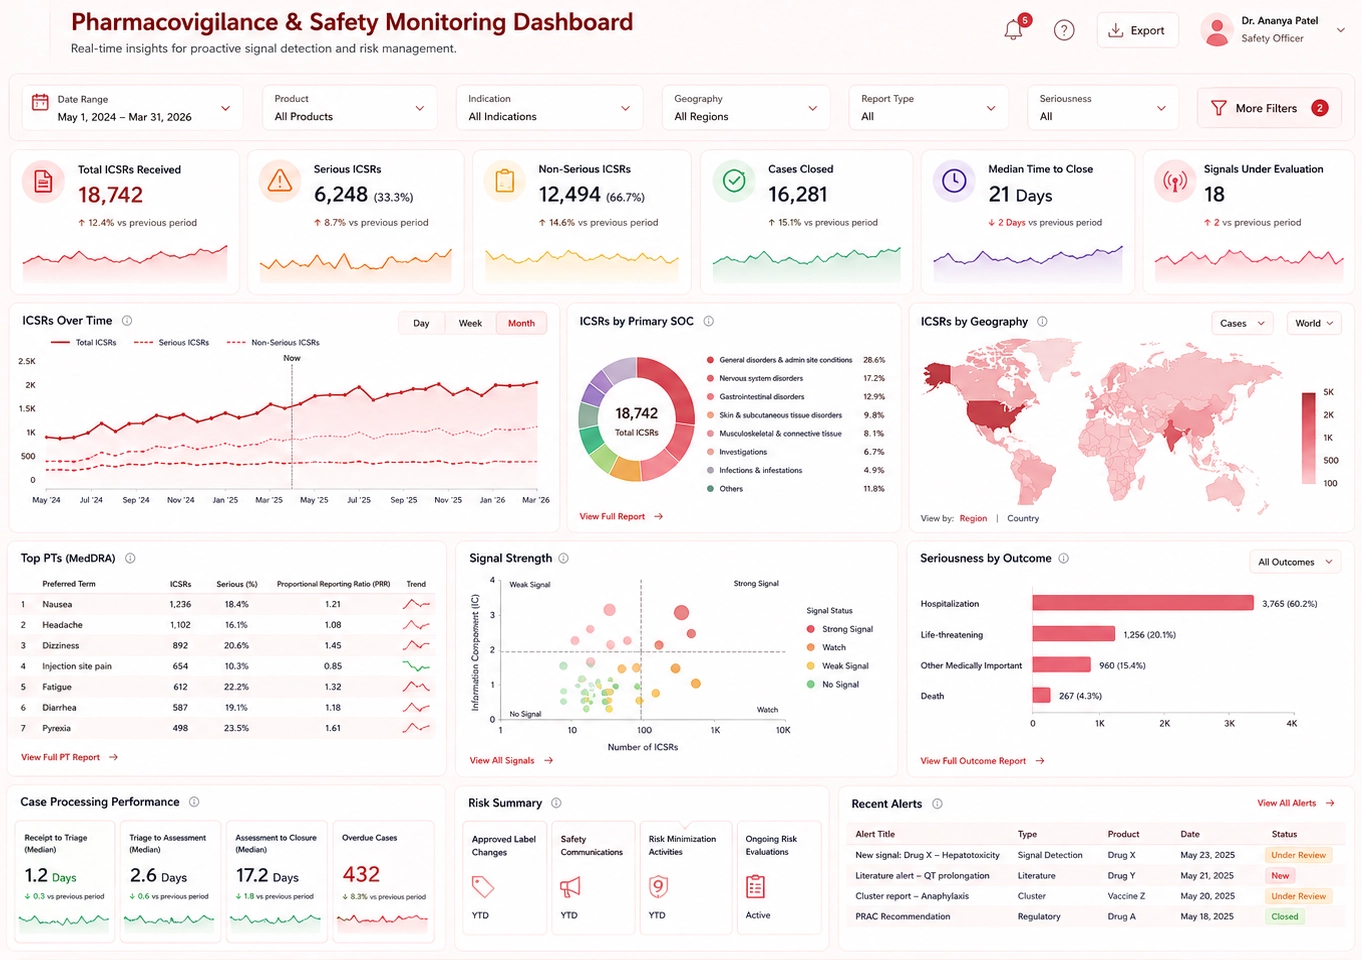
What Is Dashboard Software?
Dashboard software allows organizations to visualize data through charts, graphs, KPIs, and interactive components. It transforms raw data into meaningful insights that can be consumed quickly. Modern dashboard platforms support real‑time updates, drill‑downs, filtering, and multi‑source data blending. They also integrate with databases, cloud applications, APIs, and spreadsheets.
The best dashboard software provides:
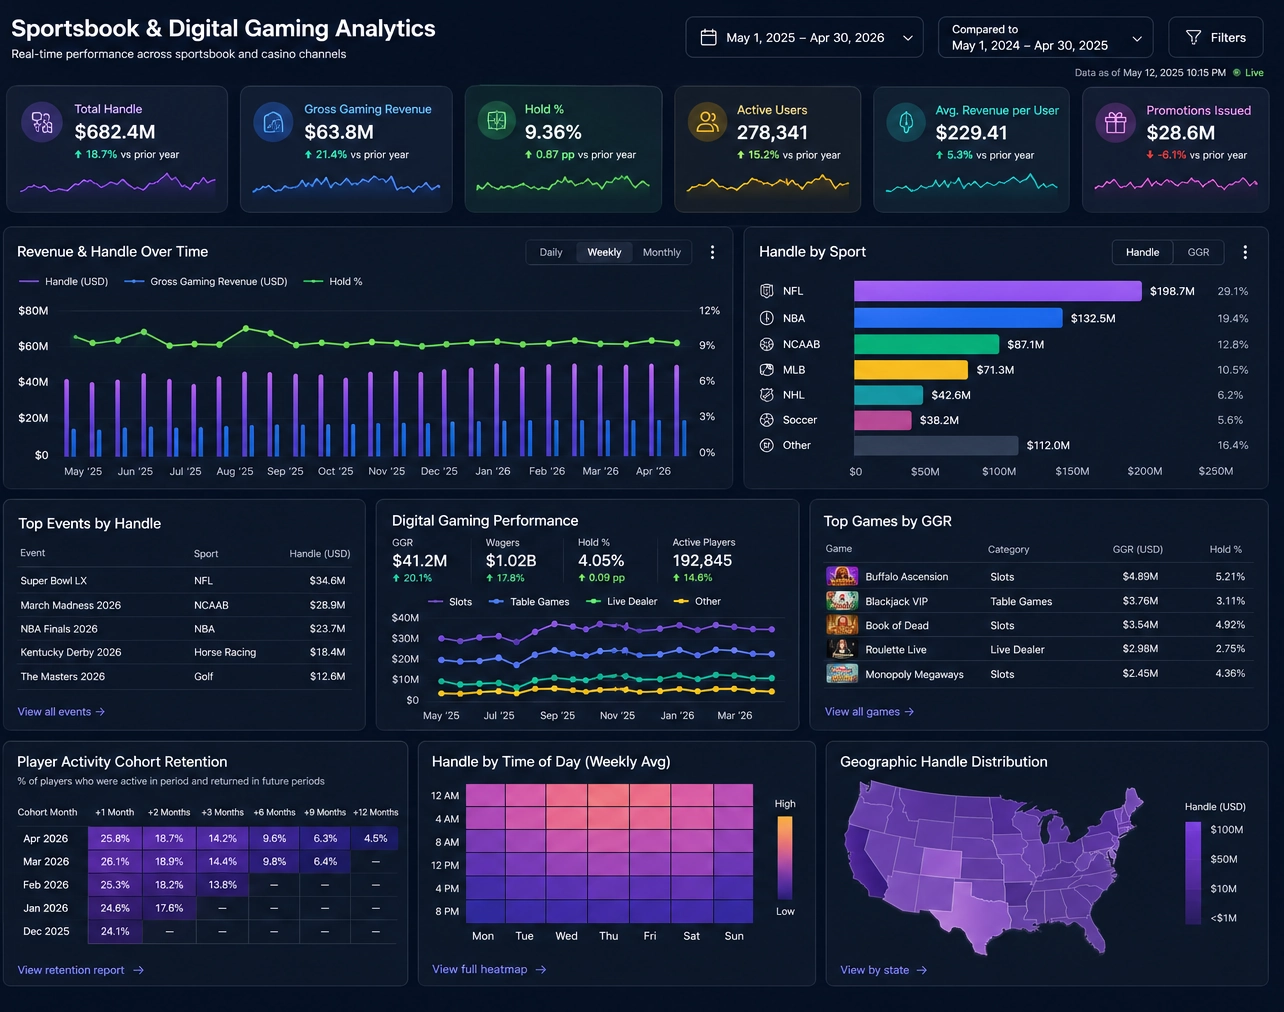
Top Dashboard Software in 2026
The dashboard software landscape includes both standalone visualization tools and full business intelligence platforms. Below is an overview of the top solutions, including strengths and limitations.
Essential Dashboard Software Features
The best dashboard platforms share a common set of capabilities. These features determine how well the tool can support real‑time decision making, data exploration, and operational monitoring.
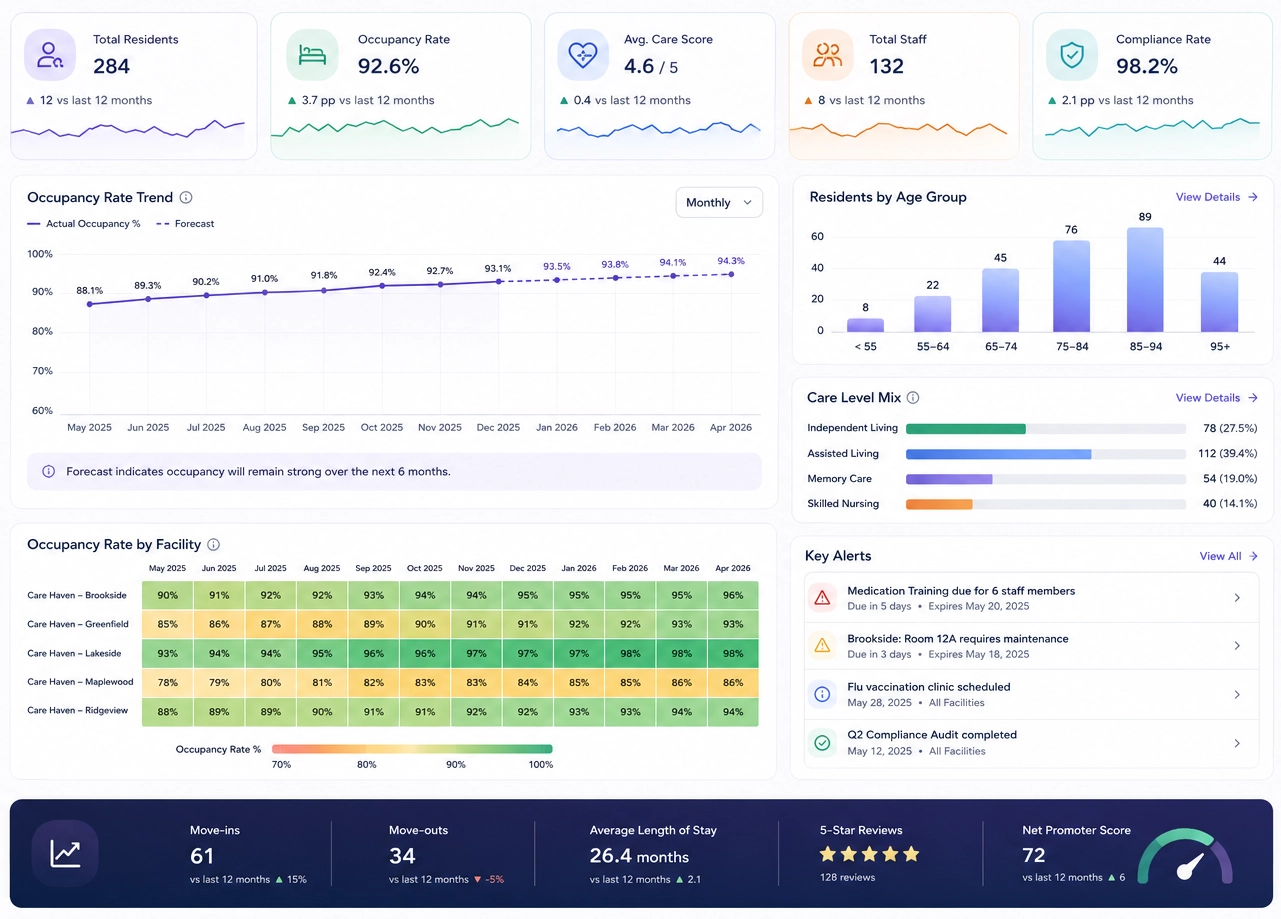
AI Dashboard Capabilities
Artificial intelligence has transformed dashboard software. Instead of manually exploring data, users can rely on automated insights, predictive analytics, and natural‑language interactions. AI‑powered dashboards reduce the time required to identify trends, detect anomalies, and understand performance drivers.
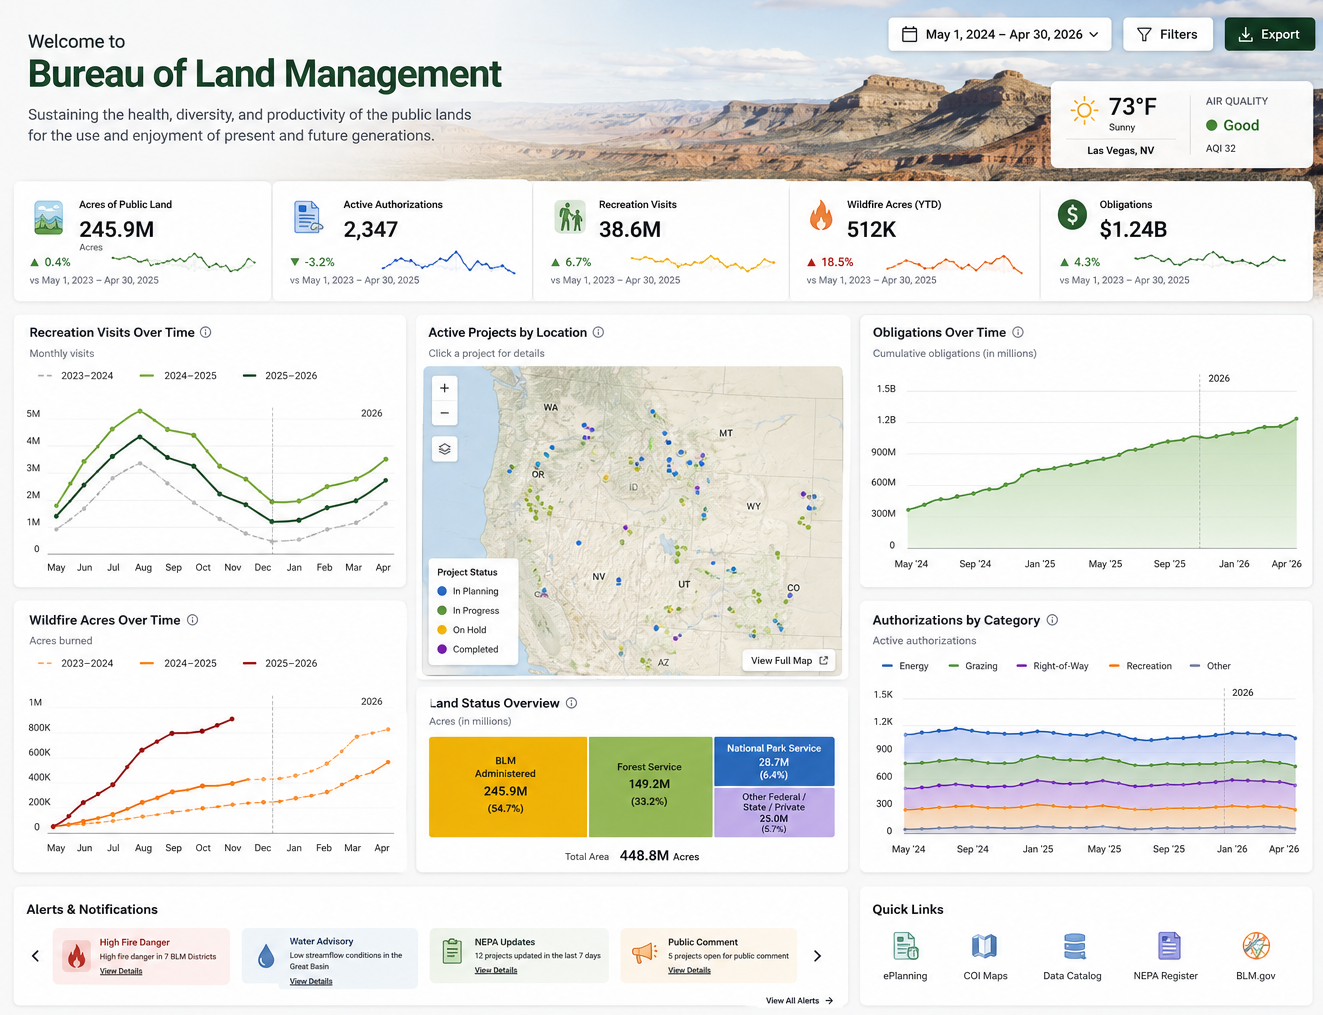
Embedded Dashboard Delivery
Embedded dashboards allow organizations to deliver analytics directly inside their applications. This is essential for SaaS platforms, OEM products, and internal tools that require integrated analytics. Embedded BI eliminates the need for users to switch between systems and ensures insights appear where work happens.
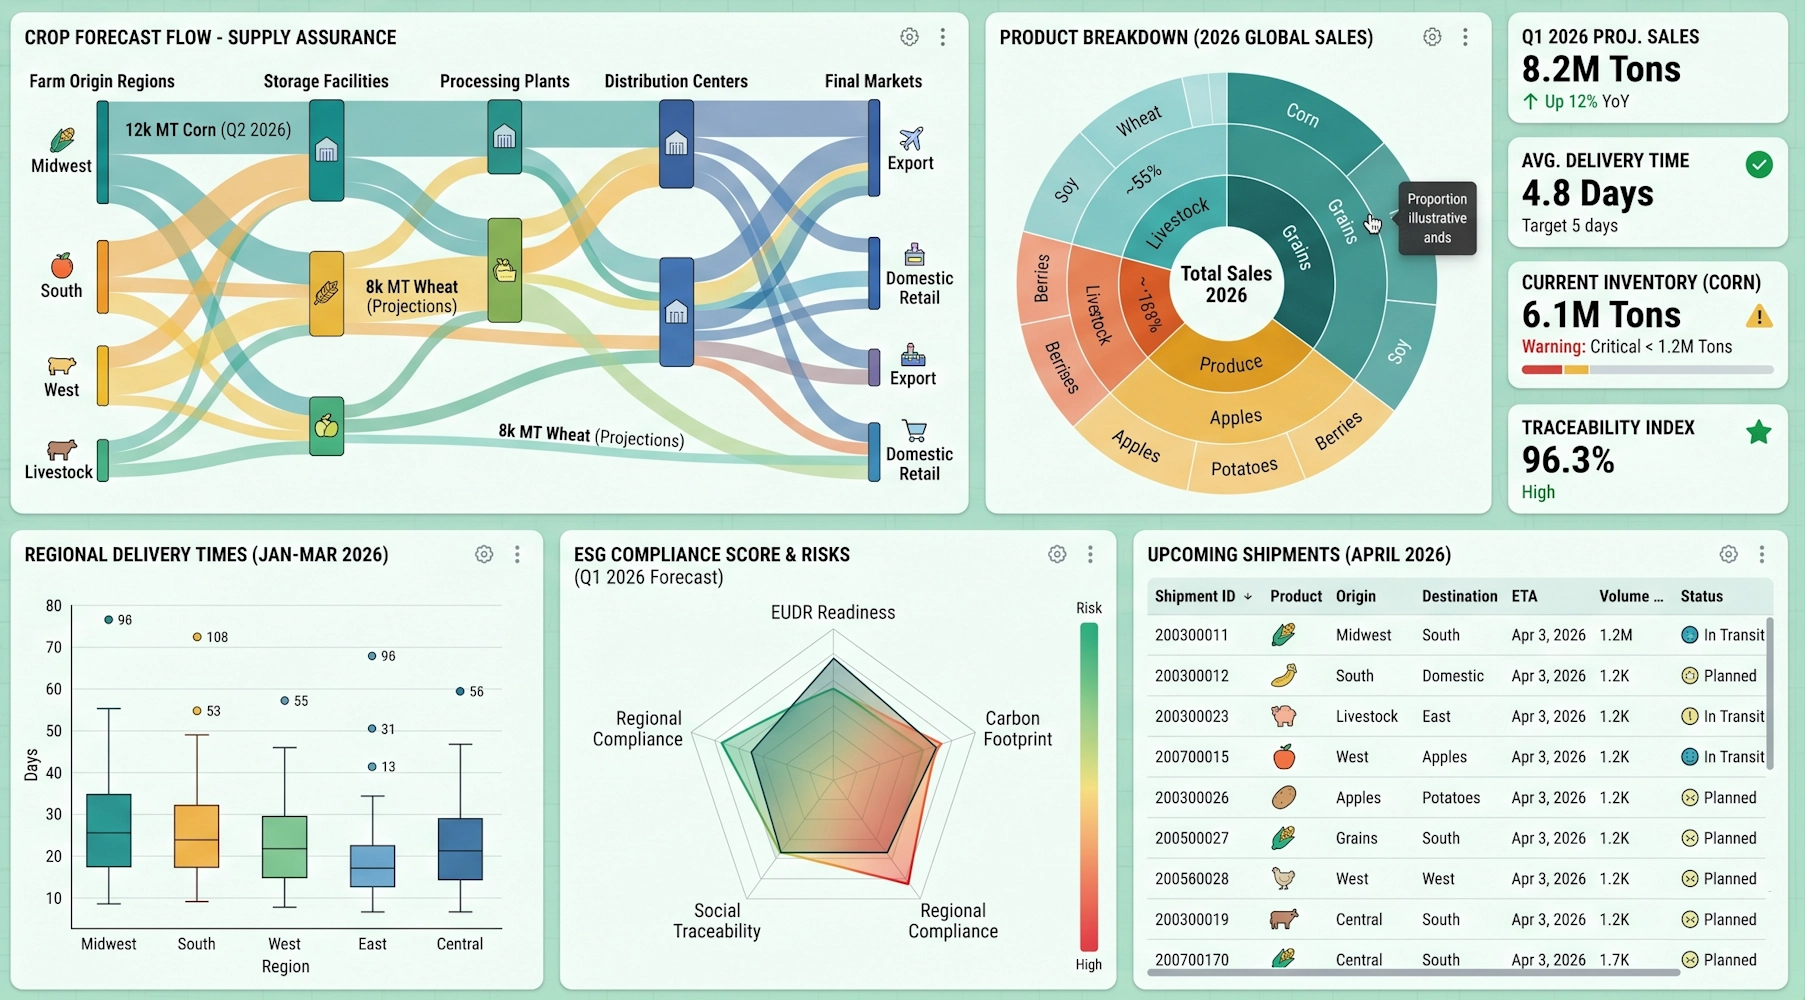
Data Preparation & Pipeline Comparison
Dashboard software is only as strong as its data pipeline. The ability to integrate, transform, and model data determines how reliable and scalable dashboards will be. Below is a comparison of major vendors across essential pipeline capabilities.
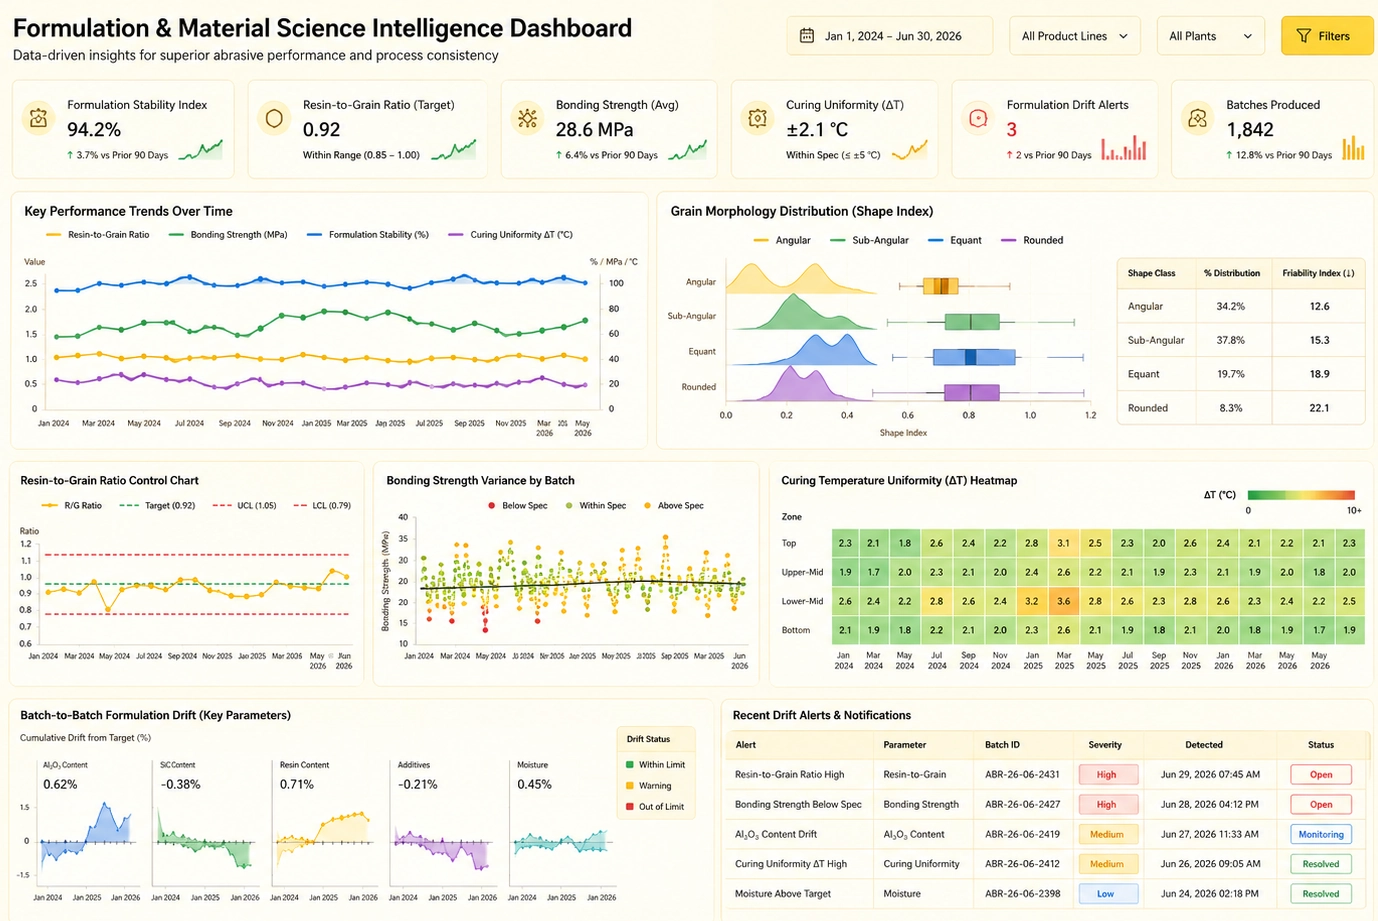
Dashboard Software Use Cases
Dashboards support a wide range of business needs. The best dashboard software adapts to different industries, roles, and data environments.
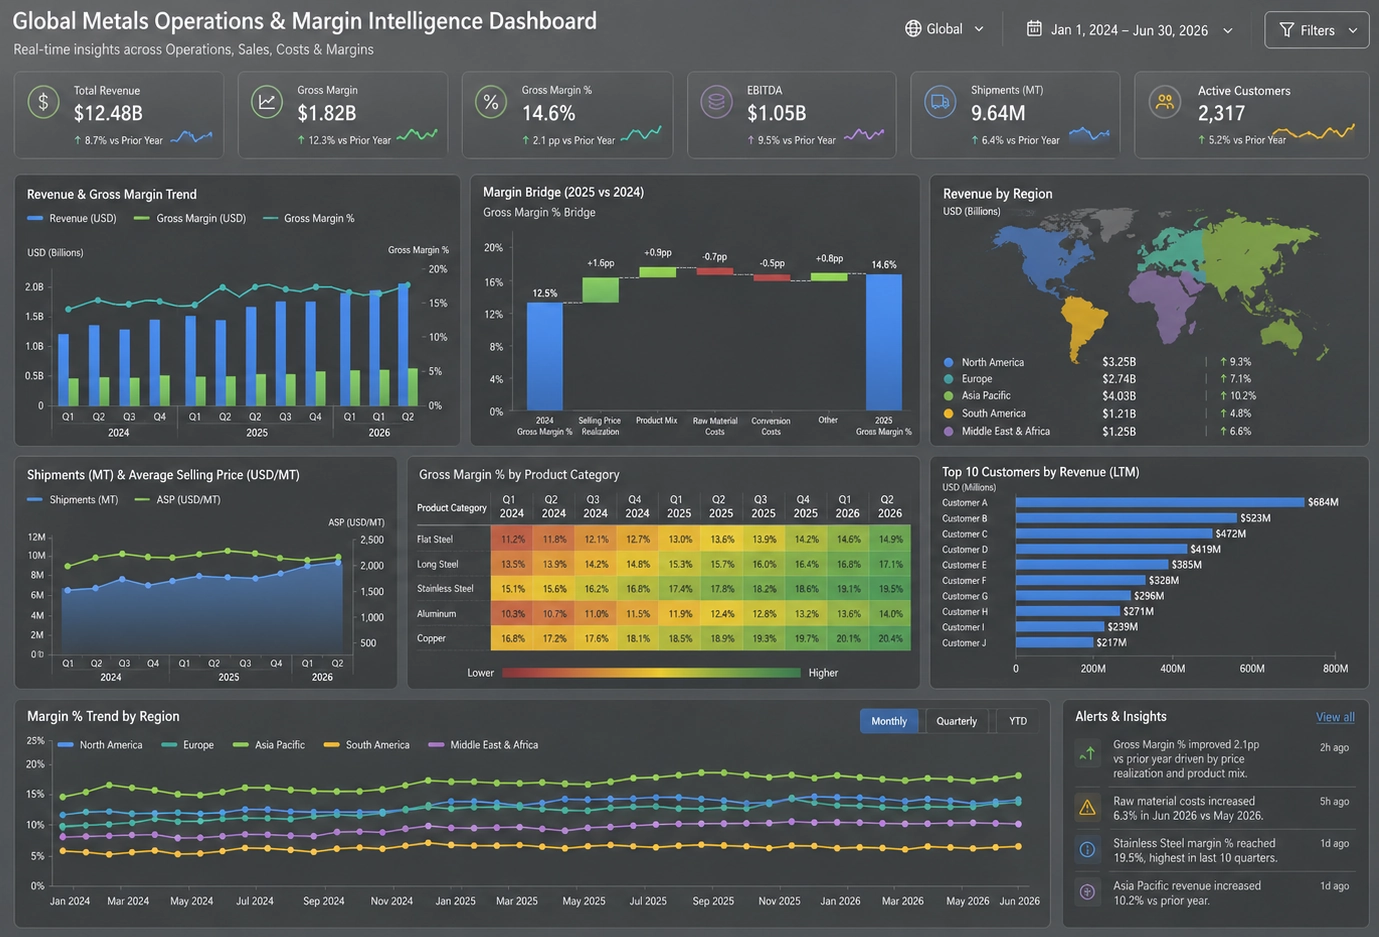
Why InetSoft Stands Out
InetSoft stands out among dashboard software platforms because it combines a full BI stack with a lightweight, flexible architecture that fits both mid‑market and enterprise needs. Unlike tools that specialize in either dashboards or reporting, InetSoft delivers interactive visualizations, governed semantic modeling, and pixel‑perfect reports in a single platform. This unified approach reduces the number of tools organizations must deploy and maintain, simplifying their analytics ecosystem.
A key differentiator is InetSoft’s powerful data mashup engine. It allows teams to blend data from databases, cloud applications, files, and APIs without requiring heavy ETL projects or complex data engineering. Business users can create governed views while IT retains control over security and performance. This balance of flexibility and control is difficult to achieve with many competing platforms.
InetSoft also excels in embedded dashboards. Its multi‑tenant, white‑label‑friendly architecture makes it ideal for OEM and SaaS providers who need to deliver analytics inside their own applications. Developers can embed dashboards and reports using lightweight integration methods while maintaining consistent performance and security. Combined with role‑based access control and scalable deployment options, InetSoft offers a compelling alternative to larger, heavier BI suites while still meeting demanding enterprise requirements.
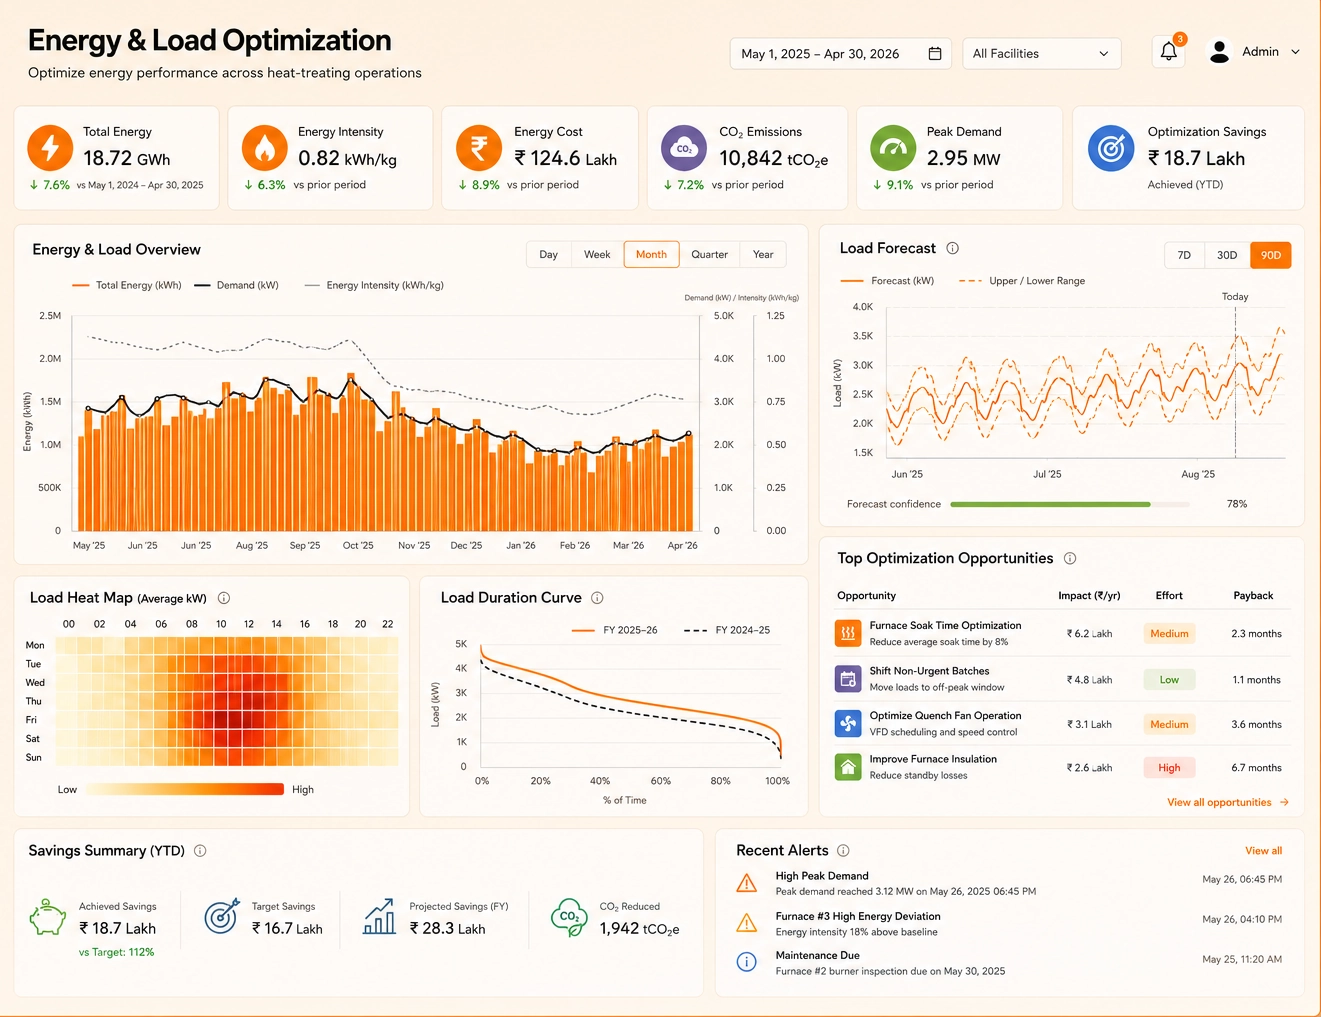
Dashboard Software FAQs
More Articles About Dashboard Software
Dashboard Performance Optimization - Slow dashboards kill adoption. Users expect analytics to feel instant, even when queries touch large datasets and complex calculations. Effective dashboard performance optimization combines caching, query tuning, dataset modeling, and layout strategies to deliver fast, reliable BI experiences at scale. This article walks through the core techniques you can use to improve dashboard responsiveness, reduce load times, and keep performance predictable as data and user counts grow. Caching is often the single biggest lever for improving dashboard performance. By storing precomputed results, you avoid repeatedly running expensive queries and calculations every time a user opens a dashboard...