Dashboard Visualization Examples
Tulip Farming Dashboard
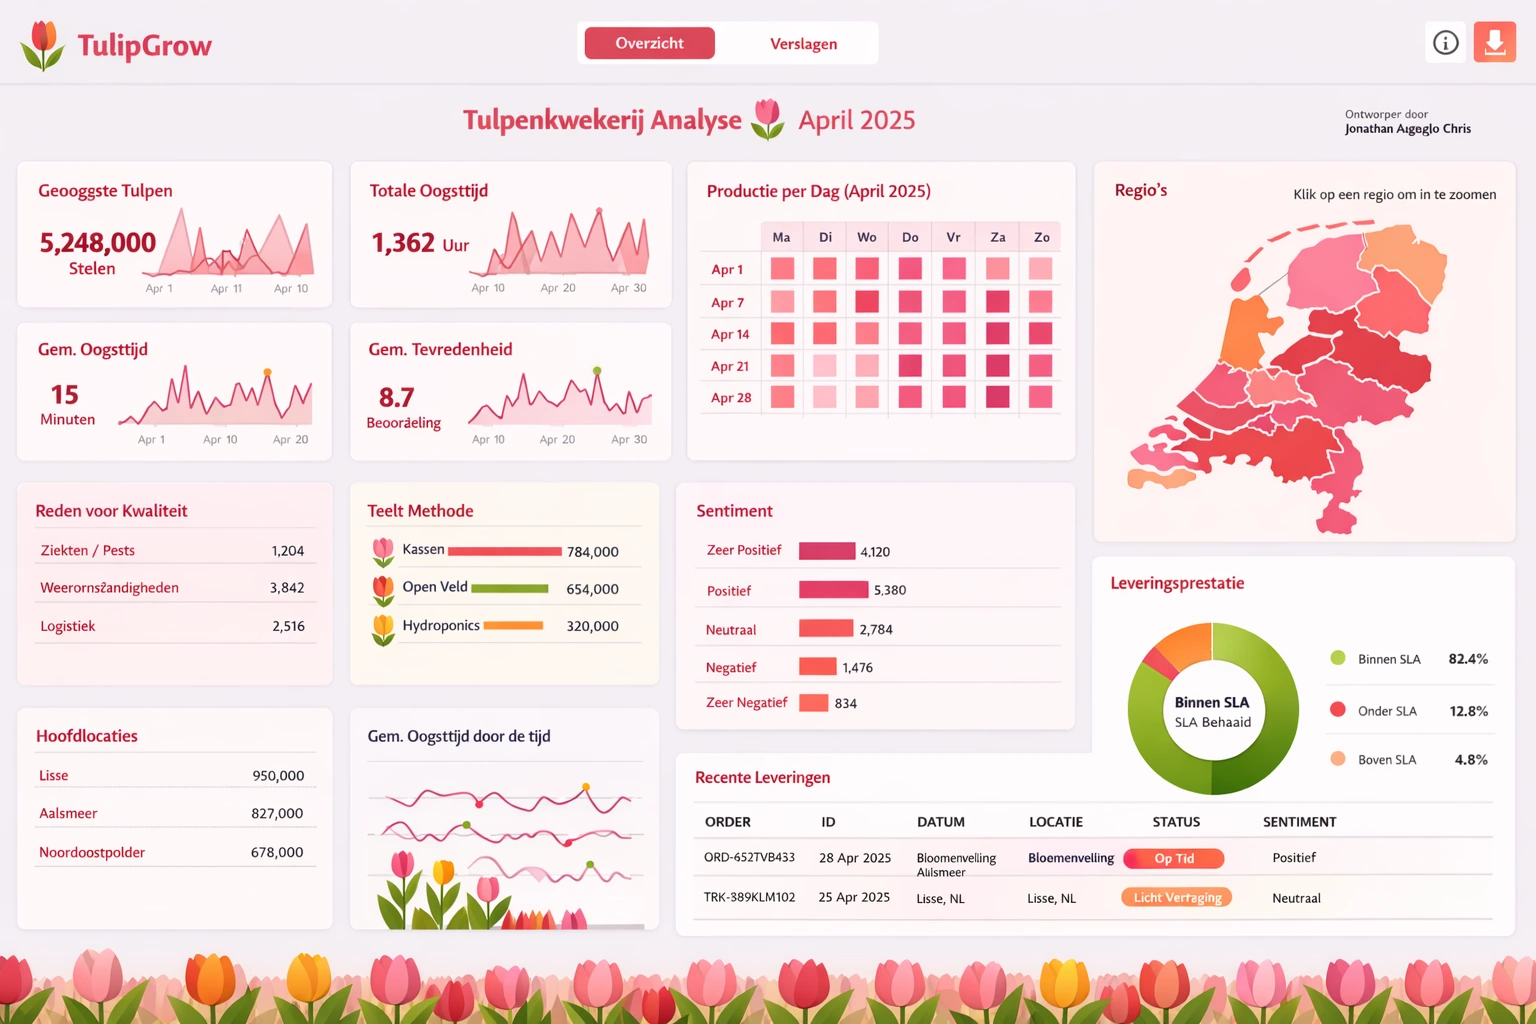
This agricultural analytics dashboard tracks tulip crop performance across multiple greenhouse facilities and field locations. Real-time monitoring of bloom cycles, temperature conditions, and inventory levels enables optimal harvest timing and distribution planning. The visualization integrates seasonal patterns with market demand forecasts to maximize profitability during peak selling periods.
Naval Dockyard Dashboard
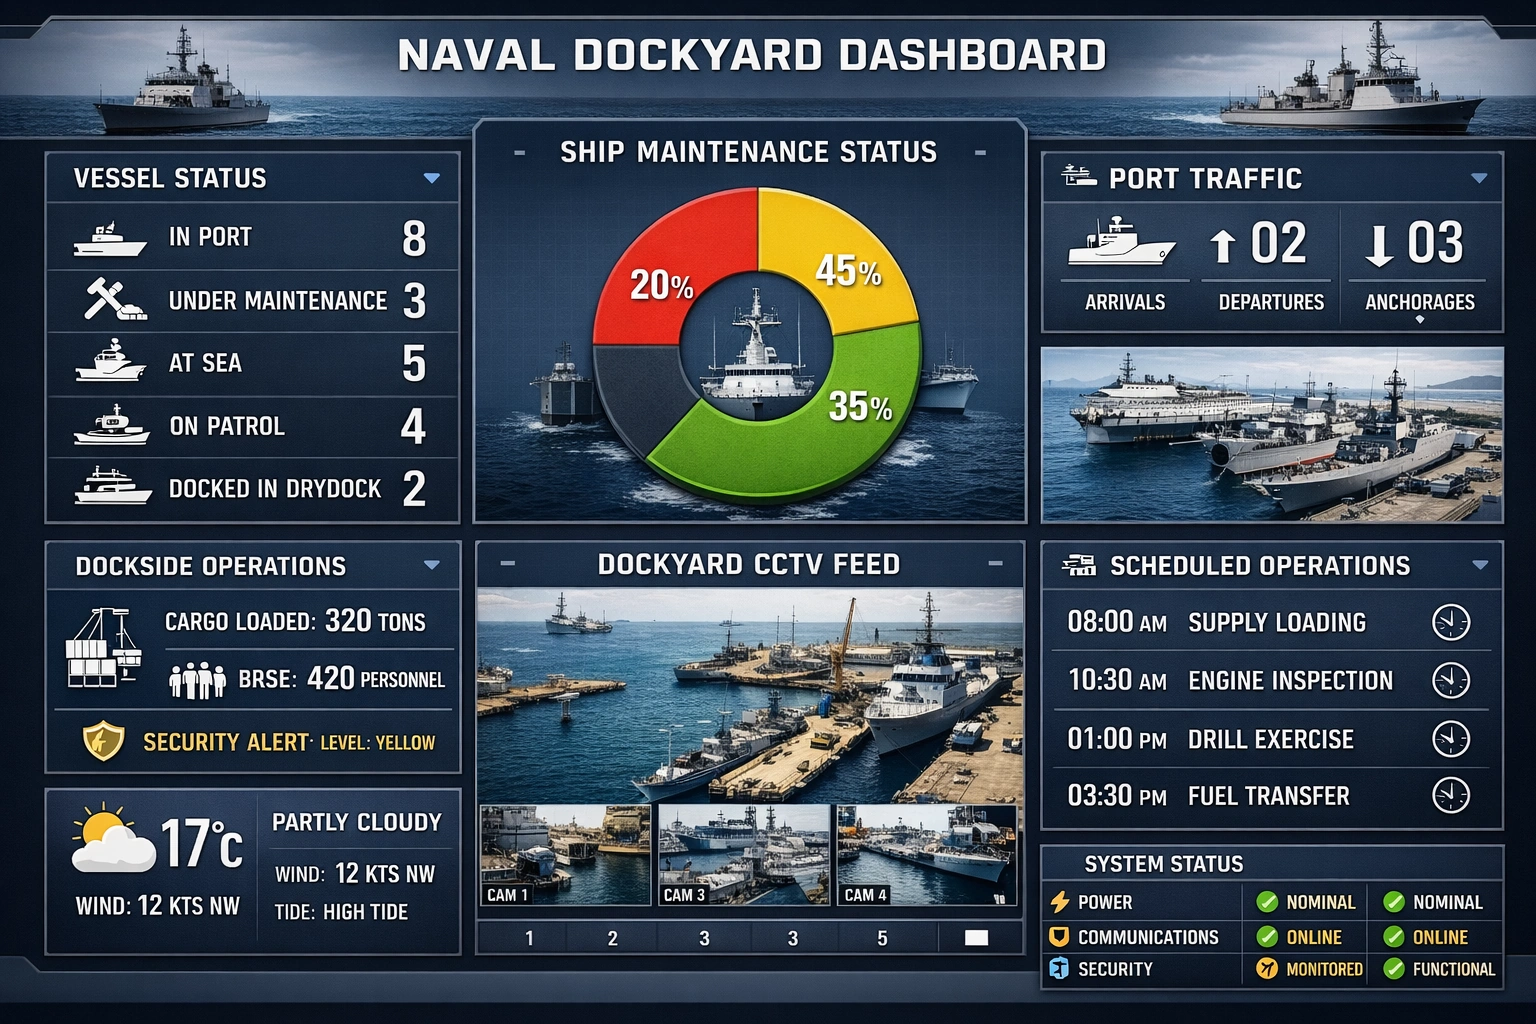
Maritime facility operations are streamlined through this comprehensive dockyard management dashboard that monitors vessel maintenance schedules, berth utilization, and workforce allocation. Critical metrics include repair turnaround times, parts inventory status, and safety compliance indicators across multiple dock locations. The system provides predictive maintenance alerts to prevent costly delays and optimize naval readiness.
Flower Delivery Network Dashboard
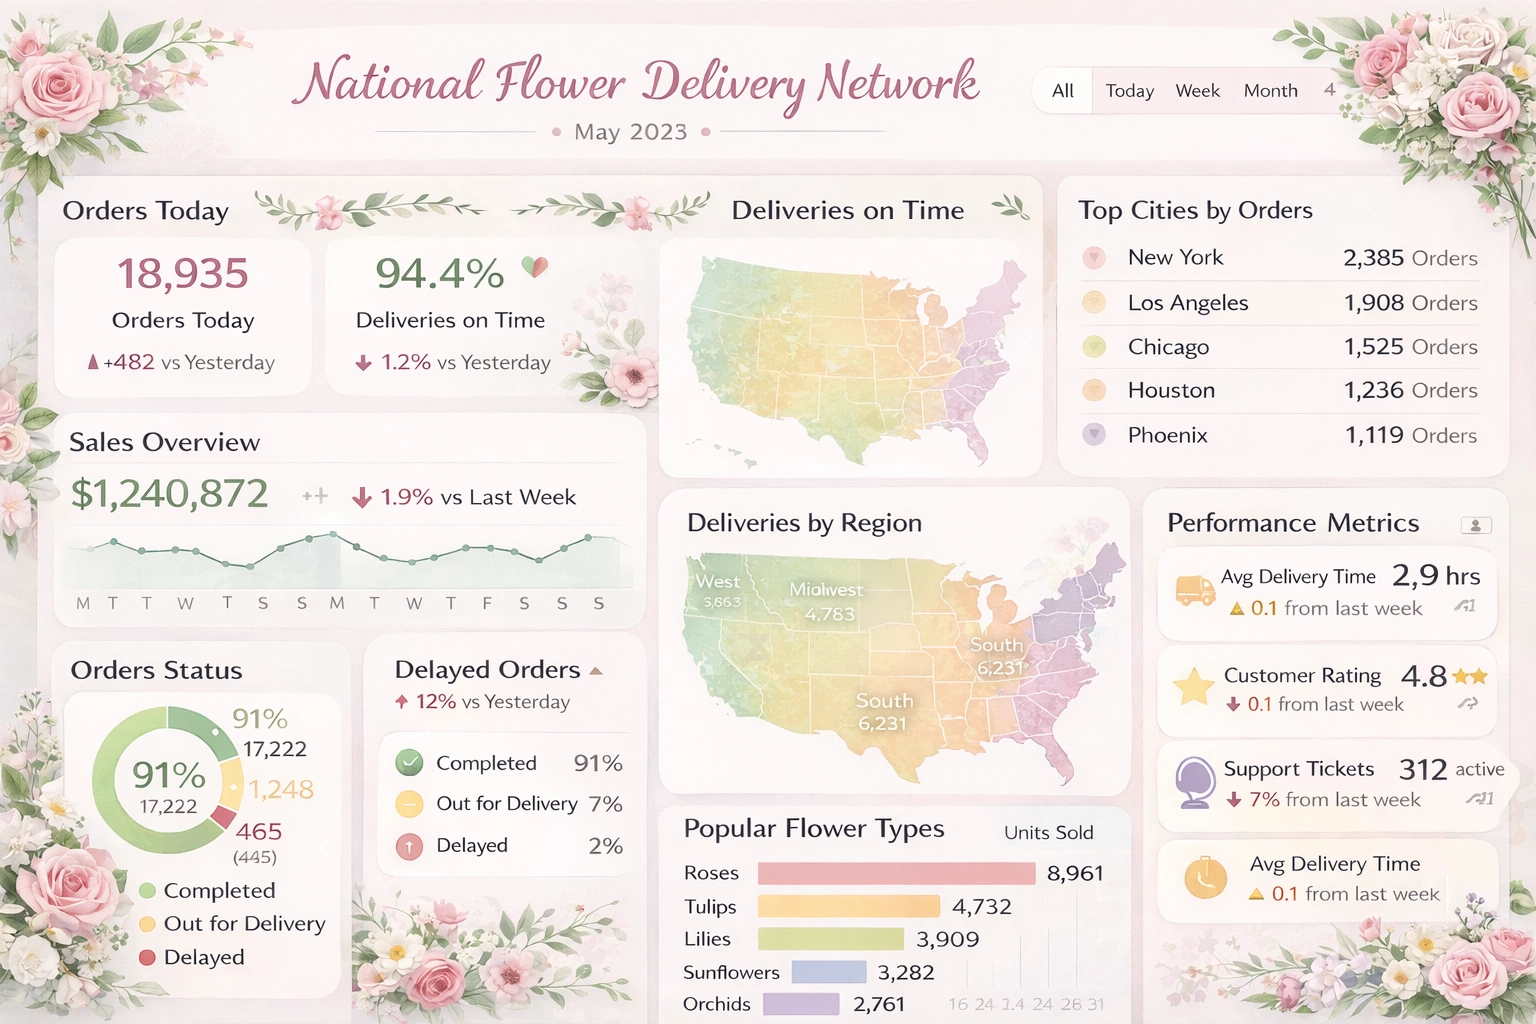
Logistics coordinators track delivery performance across regional distribution centers with real-time route optimization and freshness monitoring. The dashboard displays order fulfillment rates, delivery time averages, and temperature-controlled transport compliance to ensure product quality. Integration with supplier systems enables proactive inventory management for seasonal demand fluctuations.
Interstate Traffic Visualization
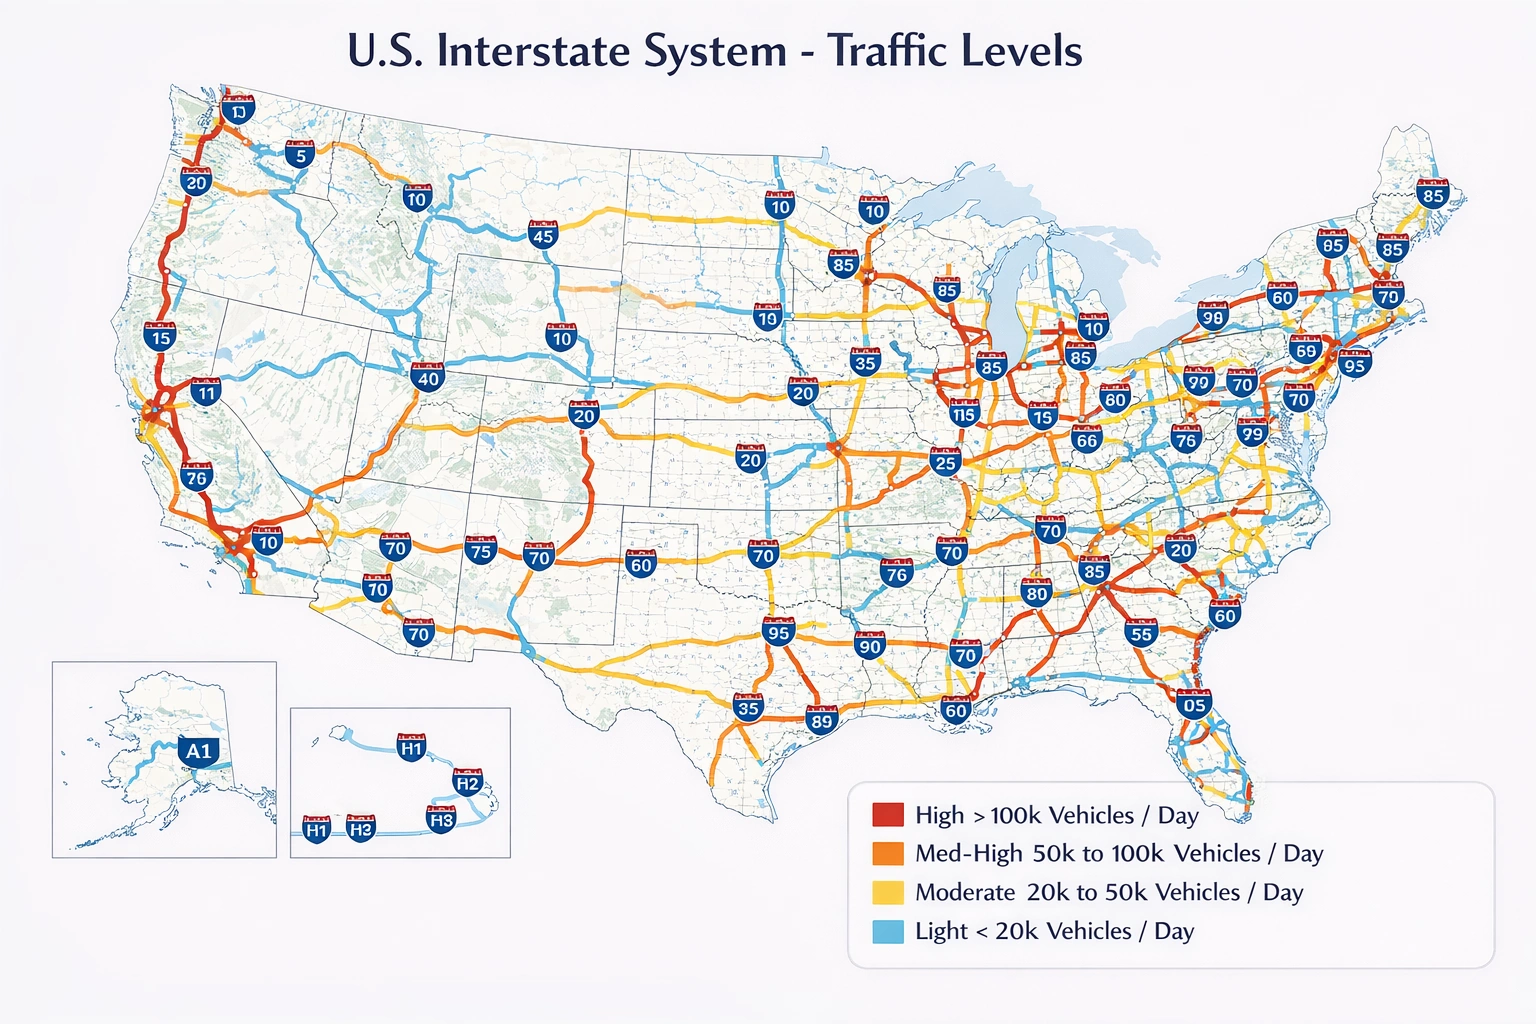
Transportation planners utilize this geospatial dashboard to analyze traffic flow patterns, congestion hotspots, and incident response times across major highway corridors. Historical data combined with real-time sensor feeds help identify bottlenecks and optimize signal timing for improved throughput. The visualization supports infrastructure investment decisions by quantifying the impact of proposed improvements.
Calibration Management KPI Dashboard
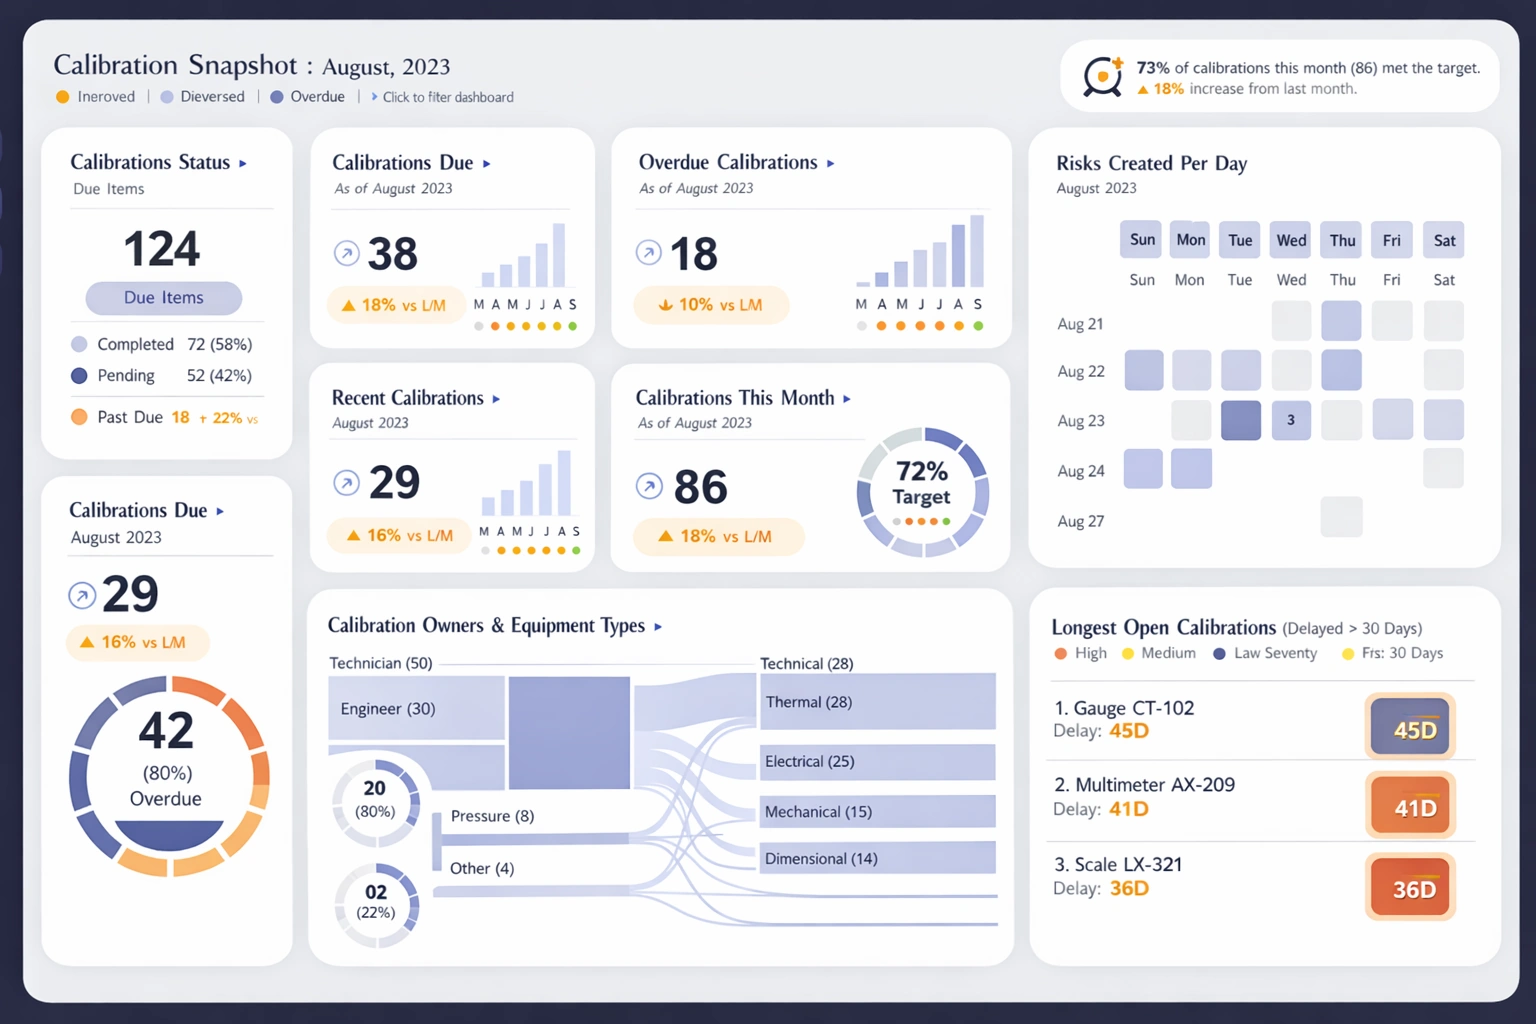
Quality assurance teams maintain measurement accuracy through systematic tracking of calibration schedules, certification compliance, and equipment performance metrics. The dashboard alerts managers to upcoming recalibration deadlines and identifies instruments requiring immediate attention. Trend analysis reveals equipment drift patterns that inform preventive maintenance strategies and budget planning.
Registered Voters Visualization

Electoral administrators monitor voter registration trends, demographic distributions, and participation rates through interactive maps and data grids. The dashboard facilitates resource allocation by highlighting areas with growing registration numbers that may require additional polling locations. Historical comparison tools help identify shifts in voter composition and inform outreach strategies.
Statistical Process Control Analysis
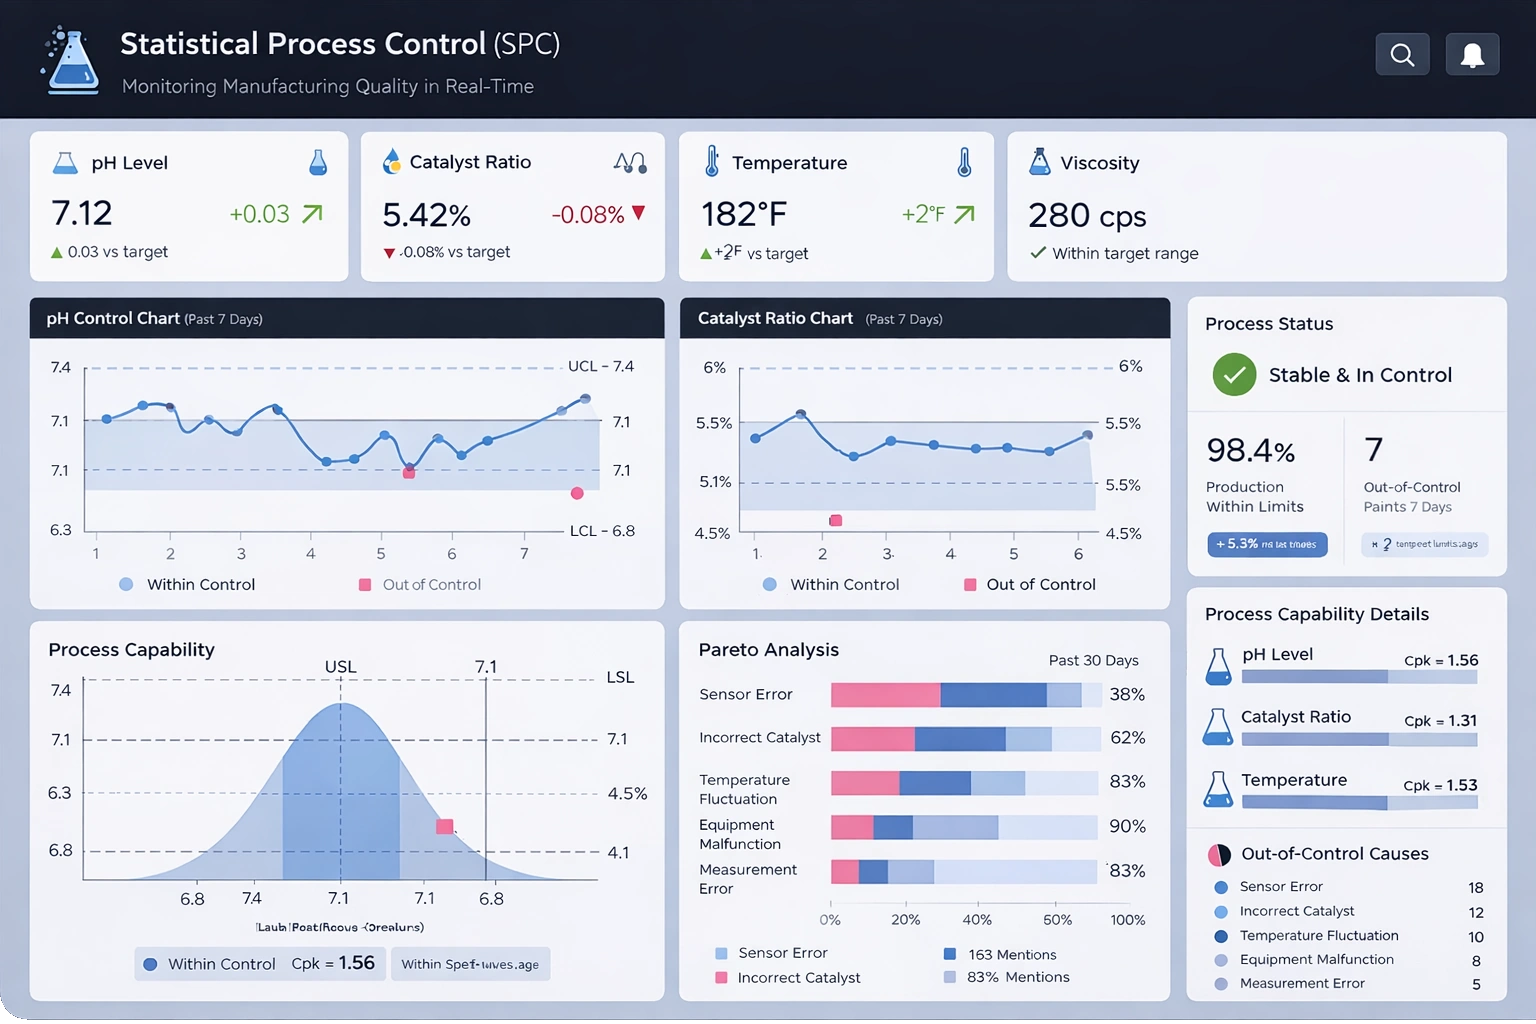
Manufacturing quality engineers track process stability and capability through control charts that detect variation patterns and out-of-specification conditions. The dashboard displays real-time measurements against control limits, calculating Cp and Cpk indices to validate process performance. Automated alerts trigger investigation workflows when special cause variation is detected, enabling rapid corrective action.
Insurance Gaming Visualization
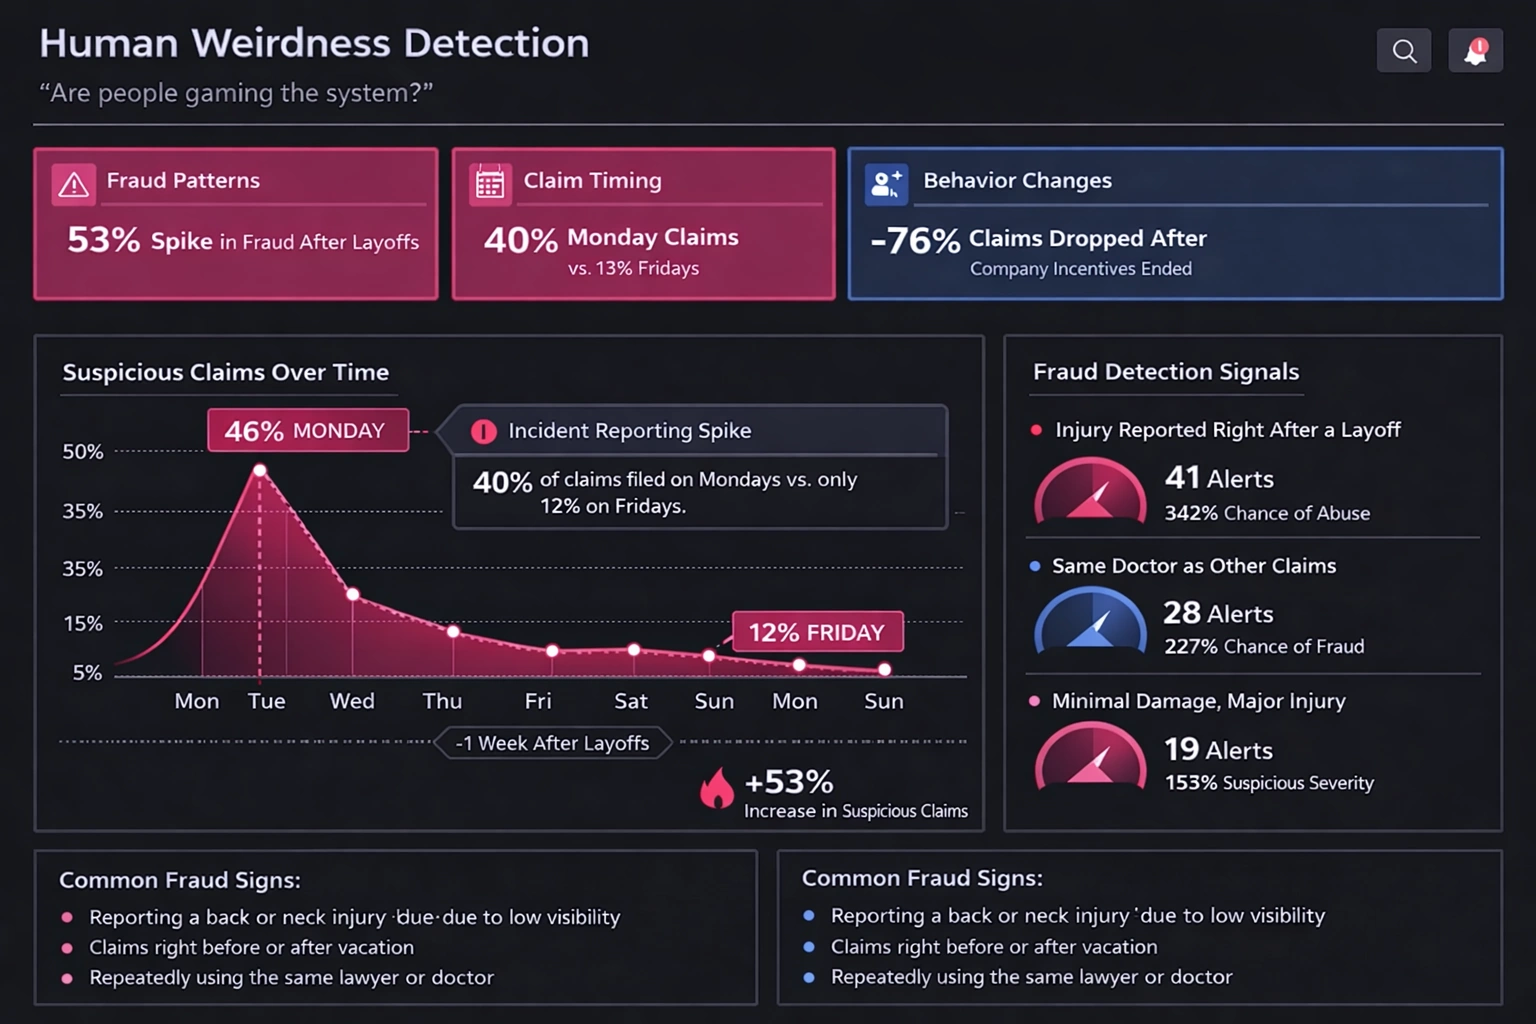
Risk analysts identify potentially fraudulent claim patterns and gaming behaviors through advanced anomaly detection and predictive modeling. The visualization correlates claim frequency, severity, and provider relationships to flag suspicious activity for investigation. Machine learning algorithms continuously refine detection accuracy by learning from confirmed fraud cases and examiner feedback.
Longevity Risk Analysis
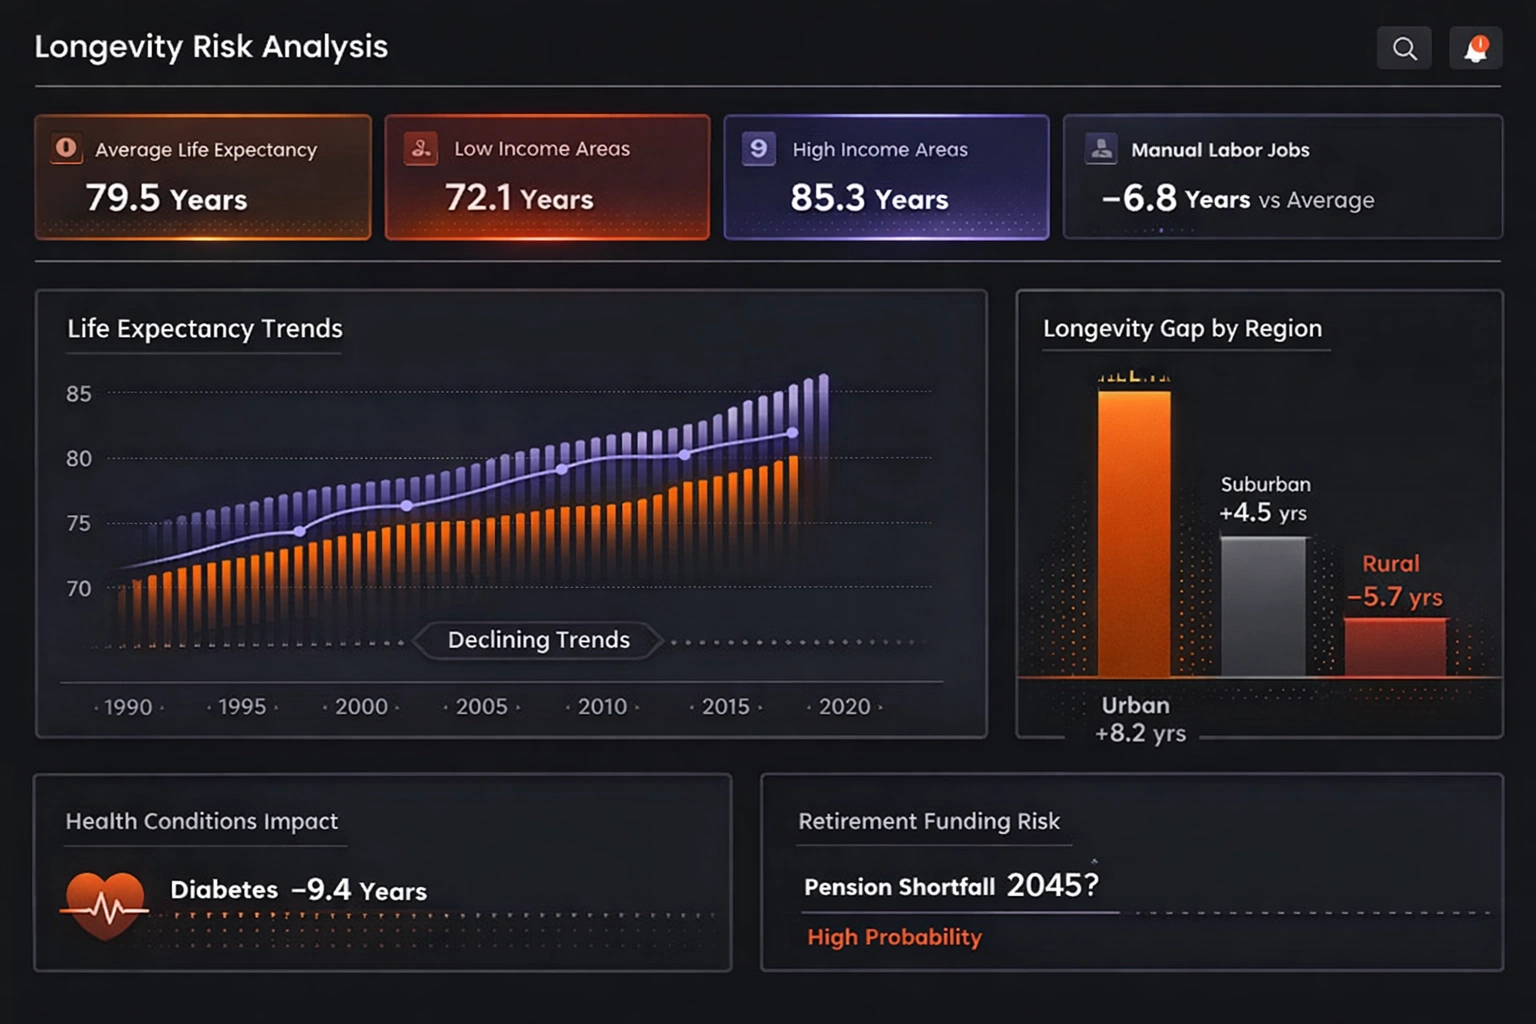
Actuaries model the financial impact of increasing life expectancy on pension obligations and insurance reserves using demographic projections and mortality tables. The dashboard simulates various longevity scenarios to stress test portfolio assumptions and capital adequacy. Sensitivity analysis helps financial institutions develop hedging strategies and adjust pricing models for long-term liabilities.
Disease Surveillance Dashboard
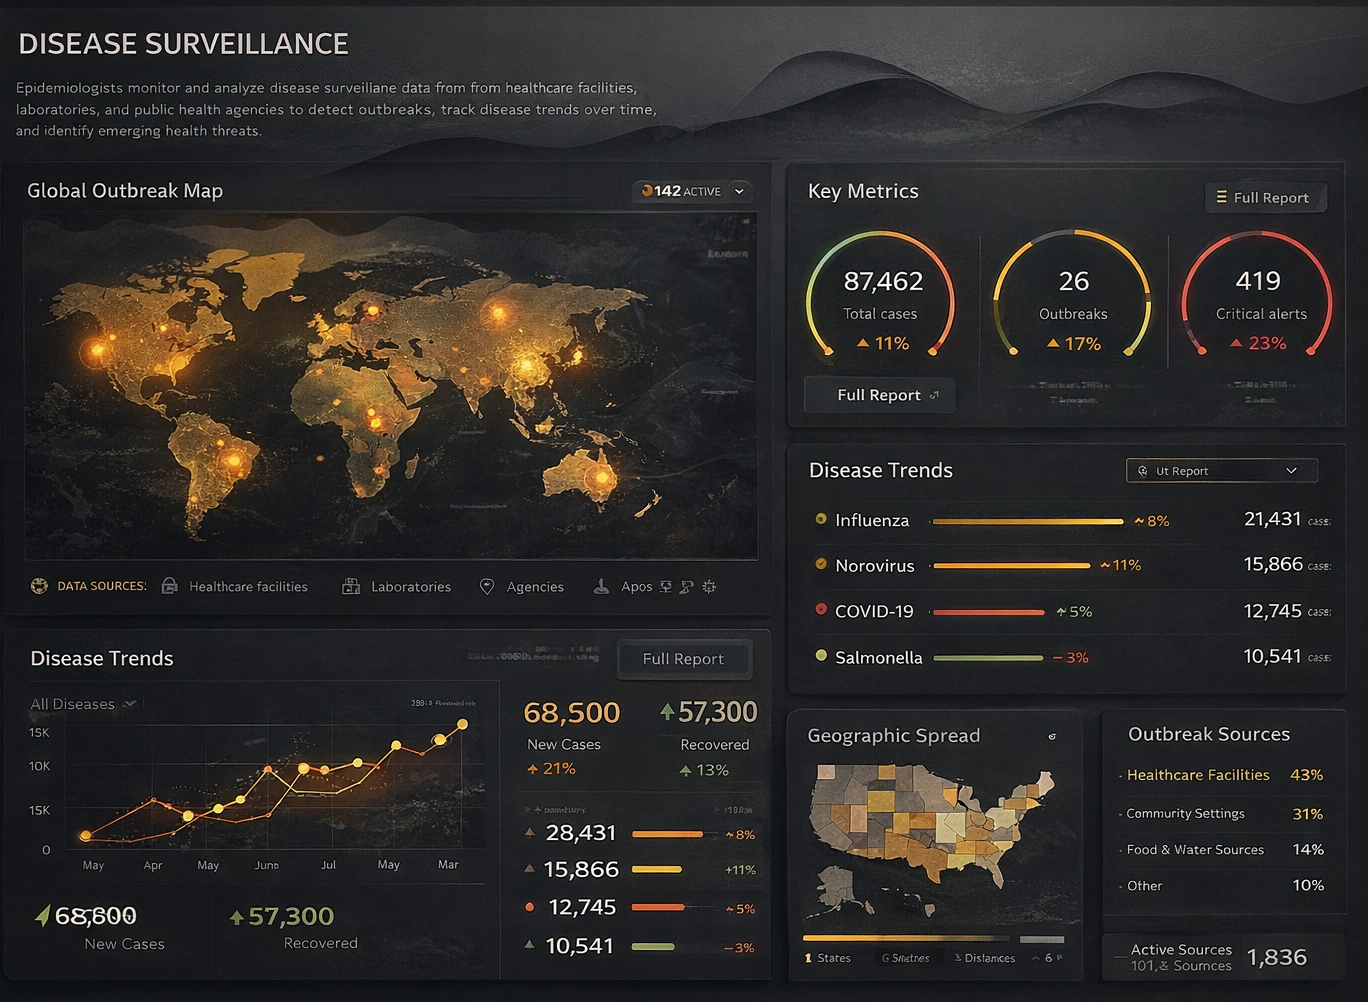
Public health officials monitor disease outbreak patterns, infection rates, and vaccination coverage across geographic regions to coordinate rapid response efforts. Real-time data integration from hospitals, laboratories, and clinics enables early detection of emerging health threats. The dashboard supports resource allocation decisions by forecasting healthcare capacity needs based on epidemiological trends.
National Park Service Dashboard
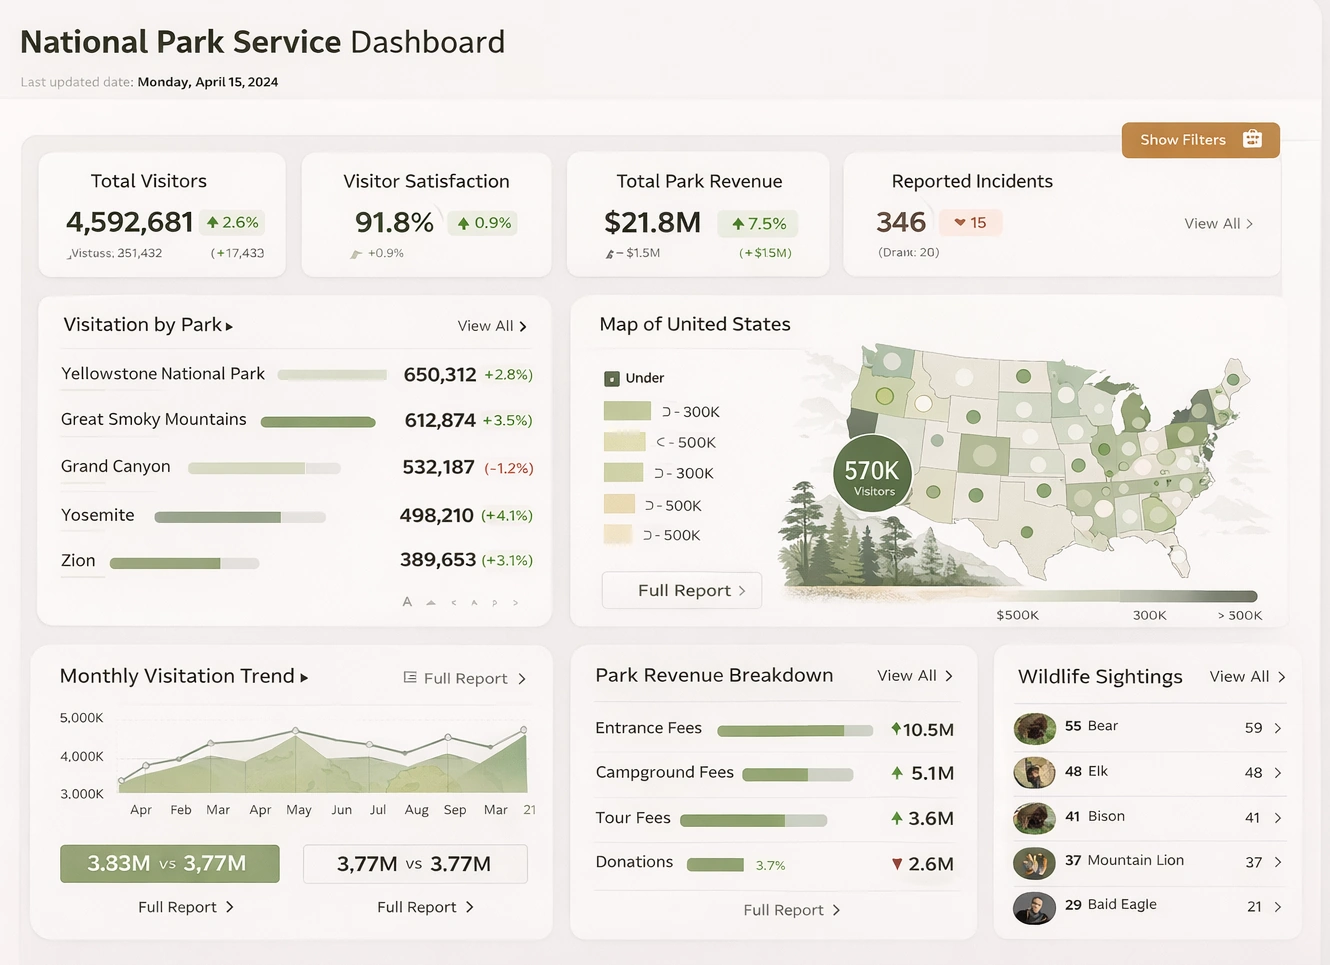
Park rangers and administrators track visitor attendance, trail usage patterns, and wildlife observation data to balance conservation with public access. Environmental sensors monitor air quality, water levels, and fire risk conditions across vast wilderness areas. The dashboard helps optimize staffing levels, facility maintenance schedules, and educational program delivery throughout seasonal fluctuations.
Sustainability Software KPI Dashboard
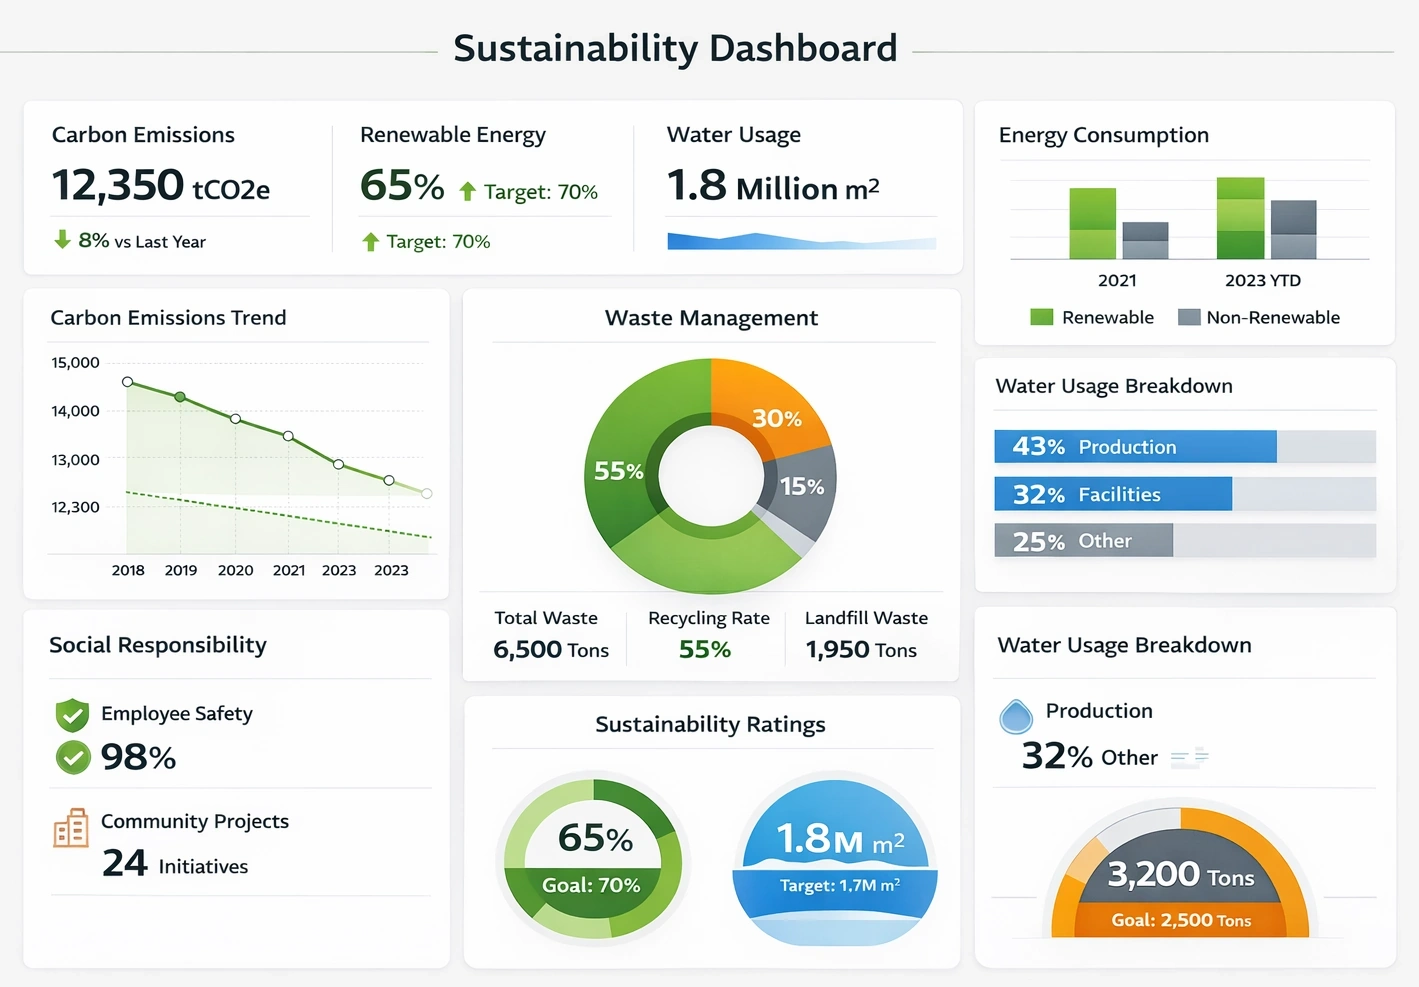
Corporate sustainability officers measure progress toward environmental, social, and governance targets through comprehensive tracking of carbon emissions, energy consumption, and waste reduction metrics. The dashboard aggregates data from facilities worldwide to provide enterprise-wide visibility into sustainability performance. Benchmarking capabilities compare results against industry standards and regulatory requirements to guide strategic initiatives.
Library System Dashboard
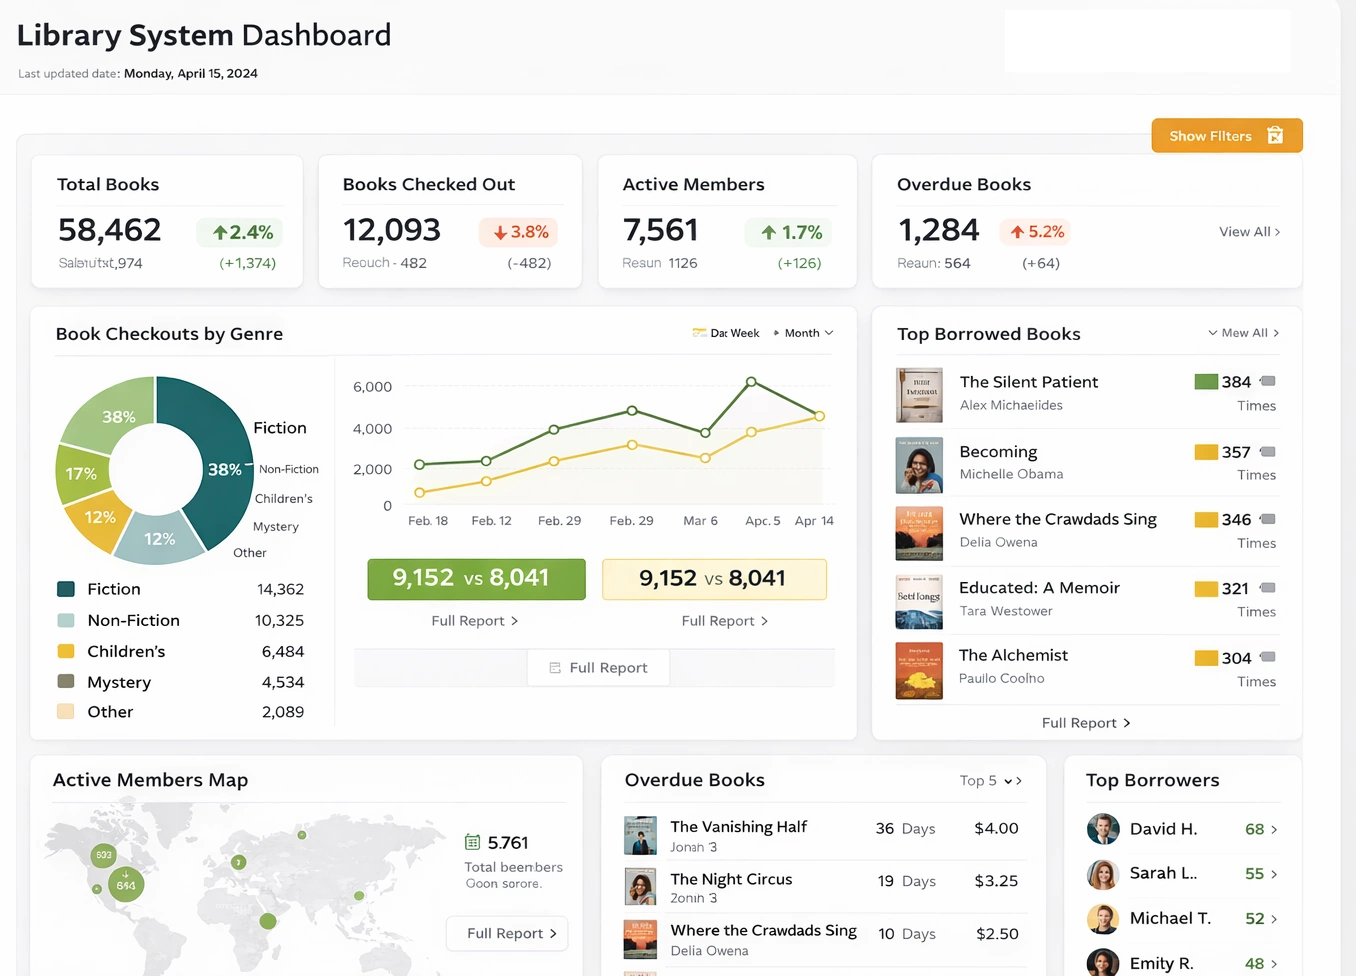
Library administrators analyze circulation patterns, collection utilization, and patron engagement metrics to optimize acquisitions and programming decisions. The dashboard tracks material availability, hold queue lengths, and digital resource access across branch locations. Usage data informs budget allocation and helps identify underserved communities that would benefit from expanded services.
Streaming Service Cohort Churn
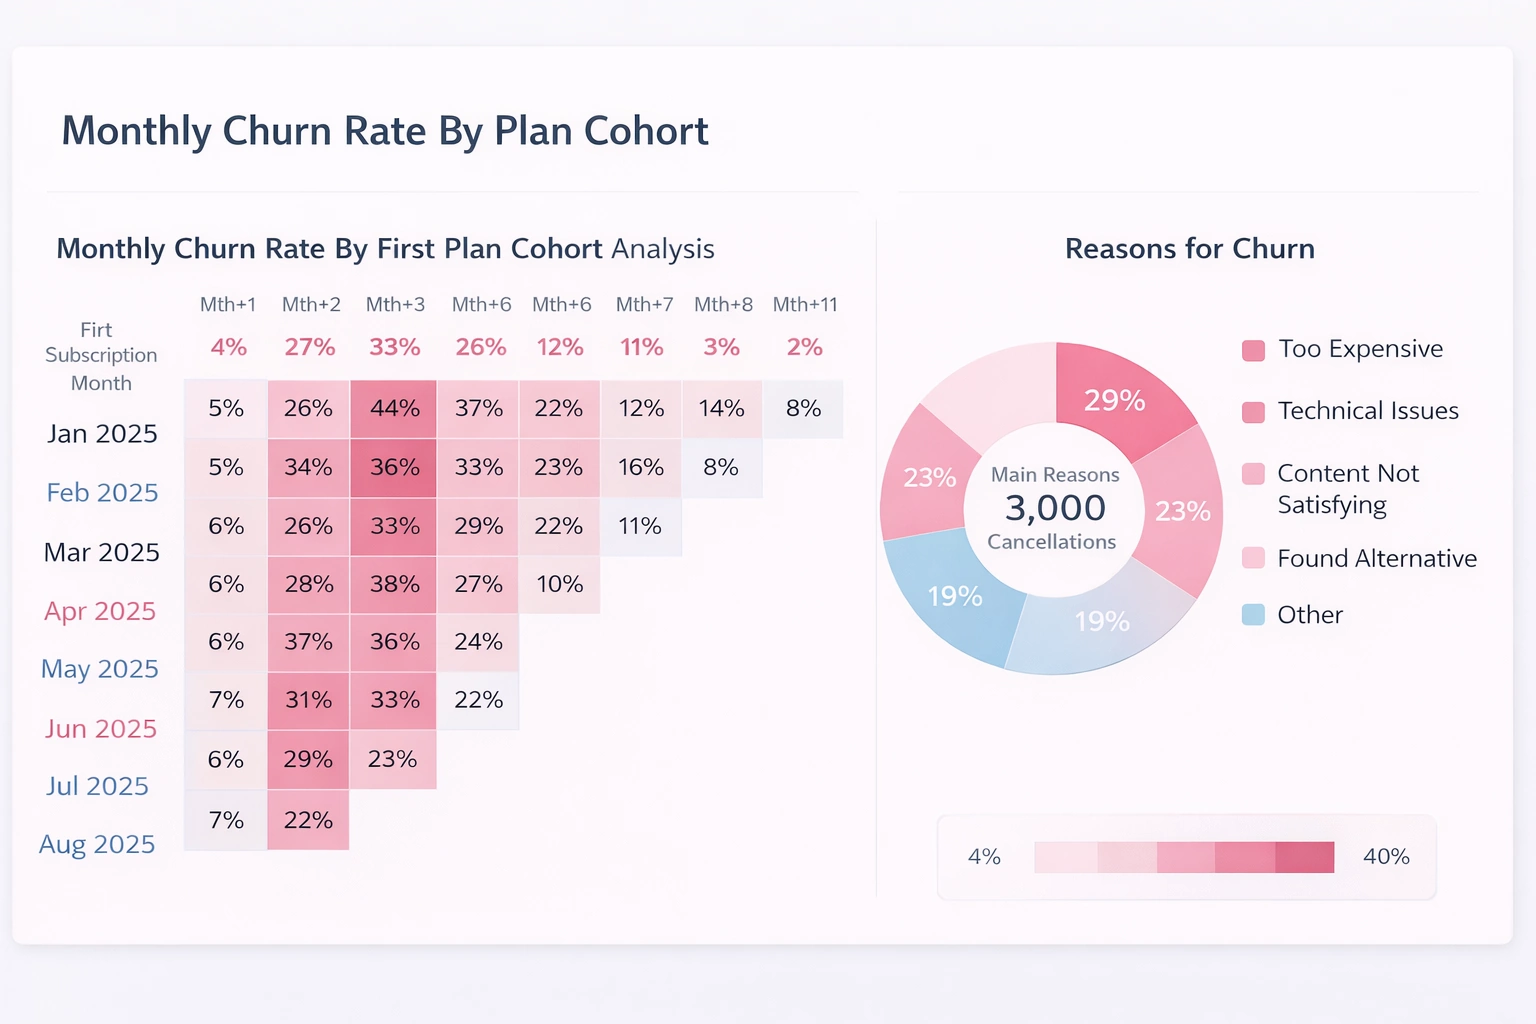
Subscription analytics teams track user retention patterns by acquisition cohort to identify factors driving cancellation behavior. The visualization reveals how different subscriber segments respond to content releases, pricing changes, and competitive pressures. Predictive models estimate churn risk for individual accounts, enabling targeted retention campaigns and personalized engagement strategies.
Workforce Skills Coverage Map
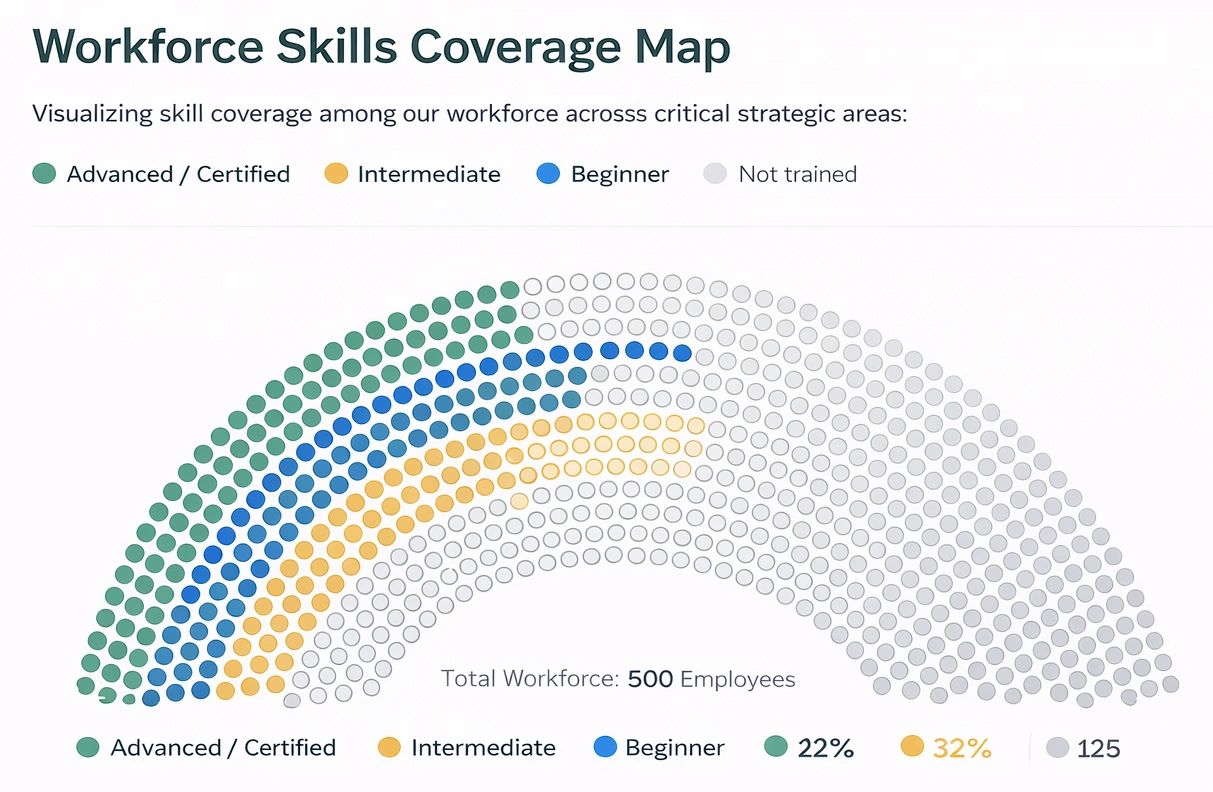
Human resources teams visualize employee competency distributions and identify skill gaps that threaten project delivery or strategic initiatives. The dashboard maps current capabilities against future workforce requirements derived from business plans and technology roadmaps. Training effectiveness is measured by tracking skill acquisition rates and certification completions across departments and locations.
Related Content
Dashboard Subquery - InetSoft's award-winning dashboard software allows users to design a dashboard subquery for hierarchical data sources creating an all-in-one business intelligence solution. When you add a filter to a table, you can choose to use a subquery to return the test conditions. This allows you to design a filter with conditions that are set at runtime based on current data. For example, consider a table with a column named 'CompanyName'. You want this table to display only companies in NY state, but the table has no 'State' column on which you can define the filter. If you knew in advance which companies reside in NY, you could enter the condition explicitly; for example, [Company][is][one of][explicit list of companies in NY]. However, if the set of companies in NY is not fixed, and can therefore change whenever the underlying database is updated, any fixed list that you enter in the condition will become outdated. In order to filter the table correctly, you need to generate a list of “companies in NY” that is always true to the current data...


Dashboard Table Column - InetSoft's award-winning dashboard software give users the ability to add dashboard table columns to interactive multidimensonal data reports. This section describes various ways to change the column properties of a table.To change a column name, double-click the column header and enter the desired text. To change the position of a column, click on the column header cell, and drag the column to the desired location in the table. A green bar shows the place where the column will be inserted. To change the visibility of a column (show or hide), click the 'visibility' button next to the column name in the column header cell. By default, all manually created columns in an embedded table are of type 'String'. To change the type of an embedded table column, follow these steps: 1. Right-click the column header, and select 'Column Type' from the context menu. This opens the 'Column Type' dialog box. 2. Select the desired data type from the 'Type' menu, and click 'OK'...
Dashboard Table Properties - InetSoft's award-winning dashboard software allows users to set dashboard table properties to their liking thereby leading to higher levels of customization and adoption. To delete a column or multiple columns from a table, follow these steps: 1. Click the header of the first column to delete. This selects the column. 2. Ctrl-click the headers of any other columns to delete. These columns are also selected. 3. Right-click on any of the selected column headers, and choose 'Delete column(s)' from the context menu. The columns are deleted from the table. Deleted columns are removed from the query. To eliminate repetitive work, an existing table may be copied to create a new one. To copy and paste a table, follow these steps: 1. Right-click the title row of the table to copy, and select 'Copy' from the right-click menu. This copies the table to the clipboard. 2. Right-click on an empty cell in the Data Worksheet where you would like to paste the copy. Select 'Paste' from the right-click menu to paste the clipboard copy into the Worksheet. A new table is created in the Worksheet at that location.Although the newly created table is a copy of the existing table, the two tables are completely independent of each other. Therefore, changes made to one table do not affect the other table. ..
Dashboard Table Query - InetSoft's award-winning dashboard software gives users sophisticared table query controls that help to enhance the creation of reports and creates a truly custom user experience. You can change various properties of a Data Table, such the table description, maximum number of rows retrieved and displayed, and the handling of duplicate rows. To change table properties, follow these steps: 1. Right-click the title row, and select 'Properties' from the context menu. This opens the 'Table Properties' dialog box. 2. Change the desired properties, and click 'OK' to exit the dialog box. The table properties are described below. The description text is displayed as a tooltip when the mouse hovers over the Table icon in the table's title row, and when the table is selected in Report Designer's data binding window. The maximum number of rows to retrieve from the database at runtime and to display in table preview. This is also the maximum number shown in Live Data mode when 'Max Rows' is less than 'Max Display Rows'. When selected, the Worksheet attempts to generate the table by forming a single SQL query, thus delegating all of the data manipulations to the database. If this option is not selected, or if the unified SQL statement cannot be formed, the table is generated in post-processing...
Dashboard Template Examples - View examples of dashboards templates created using InetSoft's easy-to-use dashboard and visualization software. Try StyleBI and Visualize Free...

Dashboard Templates - View dashboards templates designed using InetSoft's drag and drop dashboard solution, some of which can be tested with the free downloadable 5-day evaluation copy of StyleBI, while others can be seen in the free visualization tool, Visualize Free...
Dashboard Tool for REST API - Looking for a dashboarding platform that connects to a REST API? InetSoft's pioneering dashboard reporting application does and enables secure interactive dashboards and analytics. View a demo and try interactive examples...

Dashboard Tools for Visualizing Data - Are you researching dashboard tools for visualizing data? InetSoft's pioneering dashboard application makes it easy to create great-looking web-based visualizations with an intuitive drag-and-drop designer. Get cloud-flexibility for your deployment. Minimize costs with a small-footprint solution. Maximize self-service for all types of users. No dedicated BI developer required. View a demo and try interactive examples...
Dashboard Training Services - When utilizing business intelligence software, it is important to understand the full capabilities of the application. InetSoft's product, Style Intelligence, offers an easy-to-use solution to rid users of the stress and hassle of adjusting to new dashboard and reporting software. Our software is simple and easily adaptable, providing comfort for the user. Our focus is to provide software that we are confident any business professional can easily use. Data can be manipulated at the data modeling stage or during report/dashboard development. Our design features an undo button that instantly remedies any mistakes or errors with a simple click. Aside from the simple interface StyleBI provides, we ensure that all our customers are readily and properly trained in using our product. With that, our services include a multifaceted collection of on-site and Web-based training packages for each different business intelligence application. Each product comes bundled with customizable BI training and/or consulting packages to suit any customer's needs. We value the training process as one of the most essential aspects of successfully integrating StyleBI into your day-to-day affairs. These training sessions are highly interactive and personalized to accommodate the specific needs of each user...