InetSoft Product Information: Data Reporting Software
Looking for data reporting software? Since 1996, InetSoft has been offering flexible, powerful and easy to use reporting software for enterprises and OEMs. Now its award winning reporting tools include pricing options comparable to open source vendors. InetSoft's reporting-only product is Style Report Enterprise. If you also want interactive dashboarding and data mashup then look at InetSoft's flagship business intelligence software - StyleBI:
SQL Server Reporting Download - Are you looking to download a reporting application for SQL Server? Since 1996 InetSoft has been making business software that is easy to deploy and easy to use. Build self-service oriented interactive dashboards quickly. View a demo and download one of our applications for free...
SQL Server Reporting Software - InetSoft's Style Report can access data from SQL Server and many more types of data sources. You get enhanced query, reporting, and analysis capabilities with real-time access to data regardless of source, format or platform. Key benefits include: * Deliver professional, high fidelity presentation * Transform and manipulate raw data * Embed business logic with scripting * Enhance manageability and agility...
SQL Server Reporting Tool - Are you looking for a good reporting tool for SQL Server? Since 1996 InetSoft has been making reporting software that is easy to deploy and easy to use. Build self-service oriented interactive dashboards quickly. View a demo and read reviews...
Sales Reporting Tool - Style Intelligence users are given intuitive tools to create highly detailed and professional reports for their organization. Administrators of these organizations can also set permissions that enable their end users to modify reports on the fly through ad hoc reporting. Customizable dashboards (also known as viewsheets) can be configured to report information in a less static manner. StyleBI offers 100% Web-based dashboard creation for all of its users. These fully dynamic displays are capable of reporting detail on any and all aspects of a business, if that is what the administrator desires...
Salesforce Reporting - InetSoft's StyleBI for Salesforce is a SaaS application salesforce.com users can install into their environment to gain advanced dashboard and reporting capabilities for their sales, marketing, and now customer service operations data. The application comes with eight pre-built monitoring and visual analysis dashboards that provide immediate productivity. With simple point and click functionality, users can adjust the views into their data and customize their own versions of pre-built dashboards. Also included is a drag-and-drop dashboard and analysis designer tool that permits quick development of new dashboards or analysis of salesforce.com data including those in custom fields. StyleBI for Salesforce automatically saves daily snapshots of your Salesforce data and records all of the changes. Now you can: * Measure sales success rates of campaigns from start to finish. * Compare the current performance of your marketing campaigns to previous ones. Because all of your Salesforce history is now analyzable, you can spot trends or problems more quickly and take action. Now you can...

Sample Finance Report - In front of you there is a sample finance report. It's very simple, showing general ledger account, a geo description, actual amount, a budget amount and a variance. Looking at the report definition you can see it's using the same type of definitions that were available earlier, and these descriptions can be saved so that you can reuse them. You can leverage previous work and tailor reports that are preexisting and then save them with new labels. In this particular report, a summary report, it's at the company level. It's in total. But this organization also has the ability to display information at a location level as well as a department level. Now, you can do some things like drill down, or you can use the break out function. There are other opportunities here, but for today’s example we’re going to select breakout, and then let you decide how do you want this information displayed. Well, in order to get it to break out using the same labels that you’ve used in the same type of way of you define your chart of account structure in the general ledger, you’ll define what’s in component...
Sample Financial Management Report - Next, for this sample financial management report, we want to incorporate tax information, tax cost and the tax reserve. So going down here to the tax book open it up and again you will see all of those fields are readily available to you so there is the tax cost and the accumulated reserve for tax purposes. Those are all the fields of information needed for this report. Now I could skip the filters, but it will be a real big report and the goal today is to just share some things with you by having a limited set of information. So for that limited set, filters just give you the ability to not look at everything but be very focused in what it is you are going after. Double click. You can single select, and multi-select. You can pick a range of items again, for today, I am just going to double click on Company 100. And for those who are familiar with fixed assets you know that you have various types of assets. You have some that are active, some that are inactive and some that are non-depreciable assets. Well, for today’s report let’s just look at the active assets only. So that’s a couple of filters. Let’s just do a couple more filters again just to get the listing of assets down to a smaller subset...
Saving Financial Report Templates - I can save this either internally as a financial report template to base another report on it, or externally in order to retrieve it whenever I would like. So, let’s finish it. And here is your HR report. Now, and I did this all by myself. I can see my divisions. I can see my employee names. I can see gender, and I can see ethnicity. So, I created in minutes a report with all of the file fields that I wanted. It has taken me three or four minutes including time for explanations to create this report. Now, let’s say you want more of a graphical representation. Let’s say you want to see something summarized, where you have your divisions down the left hand side of your page. Then you're going to have different ethnic breakdowns in your columns and then a count by each of those locations. That’s the type of presentation that’s really going to make this information easy to digest. So to create that I think the best way to do that is to use some of the capability within the report wizard. I select table format, and I am just going to make one quick tweak here because it has highlighted all my data...
Scheduling Report Bursting - Scheduling report bursting takes mere minutes when using InetSoft's powerful reporting software, an elite business intelligence platform with a small javascript footprint. Report bursting is a batch reporting feature in which a large report is generated offline and internally segmented, or “bursted,” according to users or roles. When each user views this burst report, they will see only the segment targeted to them. Using a scheduled burst action, it is possible to deliver each segment of this report to the appropriate user/role. A Burst Action can be associated with a task by choosing 'Burst' as the action type and specifying the appropriate property values. The filename you specify for the 'Save to Disk' option, and the attachment for the 'Deliver to Emails' option can include parameters to automatically insert the report name and time/date of report generation. These parameters use the java.text.MessageFormat syntax, where “{0}” represents the report alias (report name, if no alias is specified), and “{1,date}” represents the time/date of report generation. You can specify a format for the date parameter using the java.text.SimpleDateFormat syntax. Some examples of automatically generated filenames are shown below. Because of filename restrictions, you cannot use the “{1,time}” syntax that is available for email subject lines...
Self Service Data - With more and more businesses relying on data analytics tools to measure performance, self service data is proving to be a crucial part of day-to-day business tasks. But what exactly is self service data and how can it help your business?
Self-Service Reporting - Self-service reporting allows employees to access and work with data analytics without the help of the information technology department. This approach allows users to generate custom reports and analytical queries without the help of the IT department, which will allow them to focus on other tasks at hand.
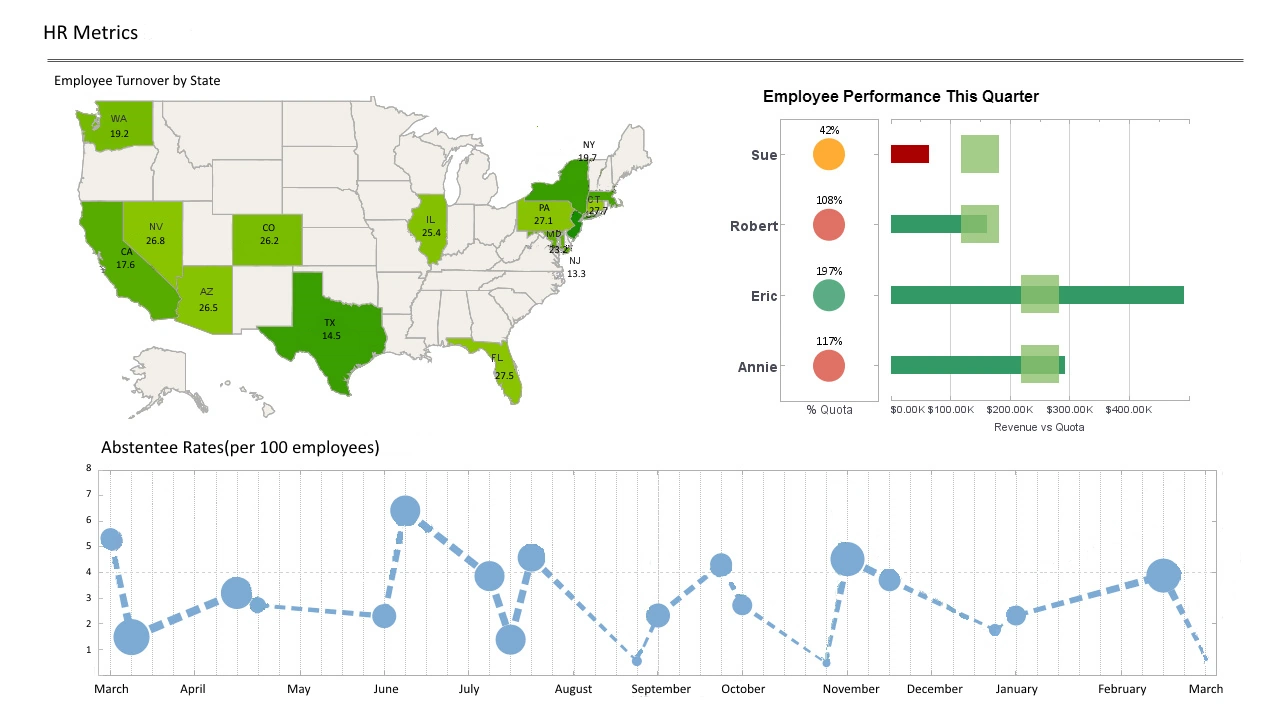
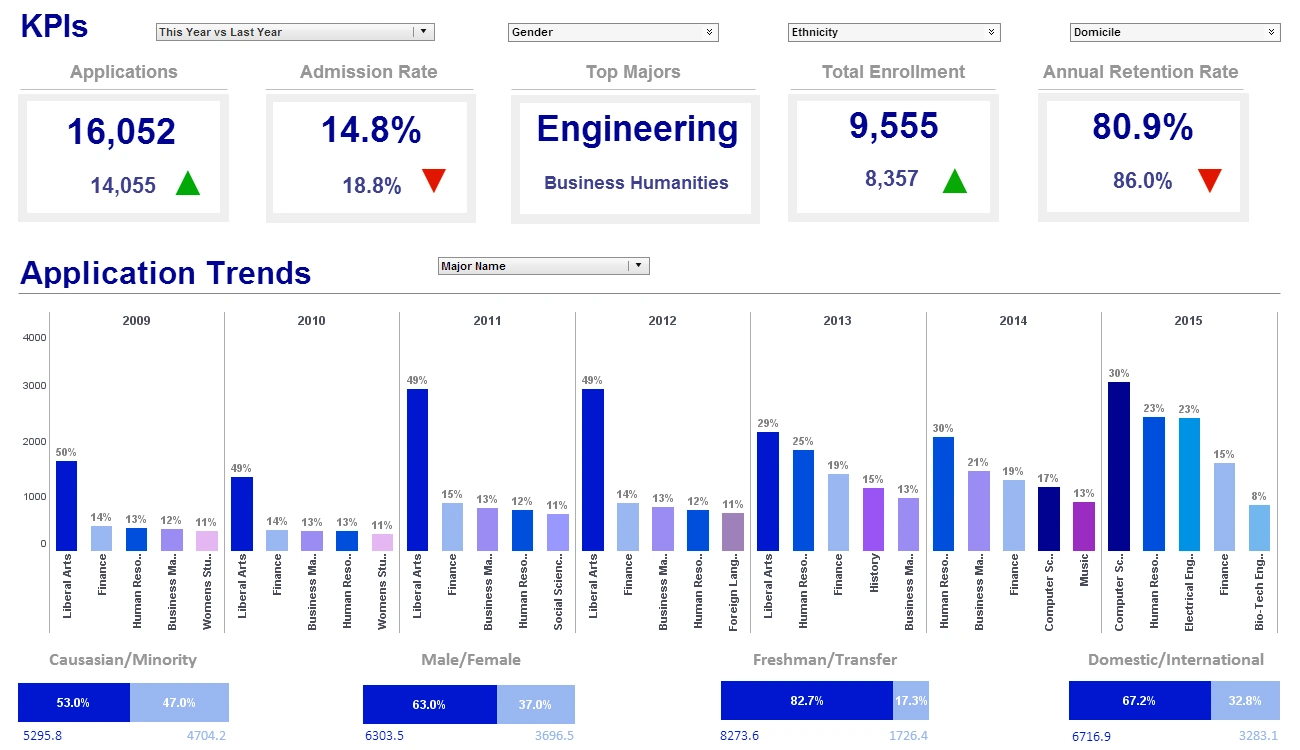
Self-Service HR Reporting - It’s a pleasure to share with you a proven reporting solution that might be new to HR folks. Today’s Webinar is specialized for HR professionals who need self-service HR reporting. You will see how you can create reports on your own within minutes. People say, it really cannot be that easy, but the answer is yes, it is possible by leveraging good design practices. We will start with a high level overview of the query and analysis functions. We will address your address you questions on what is this reporting software, what does it take to run the solution, where is it integrated, how many fields are included, and how long does it take to implement this solution. Then we will switch over, and you will see how you can create reports in minutes by using the report designer. We will walk you through creating a new payroll report as well as a benefit report from scratch. We will also show you how you can schedule your report. Then we will walk you through the standard or the sample reports that come delivered with the solution. We will walk you through both the human capital management and the financial sample reports. We will then walk you through creating a fixed asset report from scratch, and then next you’ll see how you, not your IT team or the power users of your company can create interactive analysis reports...
Self-service Reporting - The reasons for heading towards self-service reporting are almost self-evident. There are constant budget pressures, yet competitive pressures call for increased access to relevant information. IT can be caught in the middle. The pragmatic decision is to shed some of the centralized reporting function housed in IT and enable self-service reporting by business users. Years ago, this might have sounded like a radical new way of delivering information, but the trend was set in place with the advent of reporting tools as rudimentary as Excel. While sophisticated report writing still requires specialized skills and database knowledge, now even more sophisticated interactive reporting software, such as InetSoft’s, make it even more realistic to enable more self-service reporting. Now these reporting tools have become more intuitive and easy to work with. Business users, most of the time power users, can build their own reports with relative ease. Not-so-technical users can both customize the reports given to them by the power users and, when provided well-designed interactive reporting interfaces, drill through many reports that previously would have had to have been built individually. IT responsibilities do not disappear, of course, for self-service reporting. Rather they are focused on tool selection, administration, on delivering quality data on time, and production reporting. The savings are, nonetheless, appreciable...

SEO Reporting Solution - Are you looking for a good solution for SEO reporting dashboards? InetSoft's pioneering dashboard reporting application produces great-looking web-based dashboards with an easy-to-use drag-and-drop designer. Connect to Google Analytics and create dashboards that are not possible with Google Studio. Maximize self-service for all types of users. No dedicated BI developer required. Request a Demo. This dashboard mashes up SERP data with Google Search Console search volume extracted via the open API. The rankings are displayed in raw format and transformed into index values that weight the ranking by search volume to reflect impact on site visitors...
Server Report API - InetSoft Enterprise products are based on the report engine from Style Report Pro and share the same Object Oriented design approach. To address the requirements of a distributed computing environment the InetSoft advanced server report API allows a single report to be viewed from any browser. All user interactions with the report are handled by the report architecture and are transparent to the report developer. This frees the developer from the complexity of diverse environments on the Internet and allows the developer to concentrate on business logic central to the application. InetSoft Enterprise products are designed as a set of customizable server components to fit into the modern distributed computing architecture. This allows developers to take advantage of the distributed computing environment. A component-based design is required to provide seamless integration and a high level of scalability. The InetSoft server is a collection of server-side components based on the open Java RMI, CORBA and Servlet standards. Components can be tightly integrated into existing applications and servers, and they fully take advantage of services of the underlying distributed platform. Another benefit is the reduced system administration cost. Instead of being managed separately from the existing server, the InetSoft components can become an integrated part of the server and share the same administration procedures...
Server-Side Report Event Handling - The advantage of client-side event handling is its high efficiency. Because all processing is done in the viewer process, no network traffic is generated. This also eliminates the need for marshalling and marshalling for object passing. However, client-side event handling is not sufficient for all situations. Because the event to command mapping is created before the event is triggered, the mapping is static and cannot be changed when the event is generated. Sometimes it is necessary to have programming logic in place to determine what to do by checking the actual event contents. This is supported by the second stage of event processing, server-side event handling. When an event is generated, the client-side Event Handler is always checked first to see if a mapping exists for that event. If a mapping is found for the event, the corresponding command is executed on the client and the event is considered completely processed. If the client-side handler does not have any mapping for the event, the event is forwarded to the server. The server then sends the event to the event listener in the replet. Mouse events are never sent to the server due to their high frequency. They must be handled in the client-side event handler...

Server-side Reporting Features - By adding scripts that respond to user actions, you can turn a report from a static presentation into an interactive experience. All user interactions are controlled by the report server. You can access all parameters defined in a report by using the parameter object. Two forms of syntax are available. When you use the servlet-based report server (Repository Servlet) you can access the http request and session objects via script. Use the parameter array to access the HttpServiceRequest/HttpServiceResponse object, which are wrappers, respectively, for the HttpServletRequest/HttpServletResponse objects. Note: Although you can set HttpSession properties directly, the it is best to set them on the SRPrincipal. SRPrincipal can be accessed universally within the script of a report or a VPM trigger. For example, the script below handles the http session attributes and request parameters via the HttpServiceRequest object...
Service Reporting Software - Manage sales, marketing & customer service operations in a new way. Save time and see more with information-packed, customizable interactive Web-based reporting...