The Modern Reporting Technology Stack: How AI, Data Modeling, and Real-Time Pipelines Are Redefining Business Reporting
Reporting technology has undergone a dramatic transformation over the past decade. Organizations once relied on static reports, rigid data models, and slow batch processes. Today, they expect real-time dashboards, automated insights, and reporting systems that integrate seamlessly with modern data platforms. As businesses generate more data than ever before, the underlying technology powering reporting has become just as important as the reports themselves. Understanding the modern reporting technology stack is essential for anyone evaluating new tools or upgrading their analytics environment.
The Shift Toward Modern Reporting Architectures
Legacy reporting systems were built around scheduled ETL jobs, fixed schemas, and limited interactivity. They served their purpose in an era when data volumes were smaller and business needs were simpler. But modern organizations require speed, flexibility, and deeper insight. This has driven a shift toward architectures that support continuous data flow, dynamic modeling, and AI-driven automation.
Several forces are behind this shift:
- Exploding data volume: Businesses now collect data from dozens of systems, sensors, and applications.
- Real-time expectations: Decision-makers want dashboards that reflect current conditions, not yesterday’s snapshots.
- Self-service analytics: Business users expect to explore data without relying on IT for every report.
- AI-driven insights: Reporting is evolving from descriptive charts to automated explanations and anomaly detection.
These trends have pushed reporting technology toward more modular, scalable, and intelligent designs.

The Semantic Layer: The Backbone of Modern Reporting
One of the most important components of today’s reporting technology is the semantic layer. This layer defines business metrics, hierarchies, and relationships in a consistent, governed way. Instead of each report calculating metrics independently, the semantic layer ensures that “revenue,” “utilization,” or “customer churn” mean the same thing everywhere.
A strong semantic layer supports:
- Consistent metrics across dashboards and departments
- Reduced duplication of logic
- Faster report creation
- Reliable self-service analytics
Without a semantic layer, organizations often struggle with conflicting numbers and inconsistent definitions. With one, reporting becomes more trustworthy and scalable.
AI’s Expanding Role in Reporting Technology
Artificial intelligence is reshaping reporting in profound ways. Instead of manually exploring data, users can rely on automated insights, narrative explanations, and anomaly detection. AI can highlight trends, explain variances, and even generate full written summaries based on underlying data.
AI-driven reporting improves:
- Speed: Insights appear instantly without manual analysis.
- Accessibility: Non-technical users can understand complex data.
- Decision-making: Automated explanations reduce misinterpretation.
As AI models continue to advance, reporting technology will shift even further from passive visualization to active insight generation.

Real-Time Data Pipelines Replace Batch Reporting
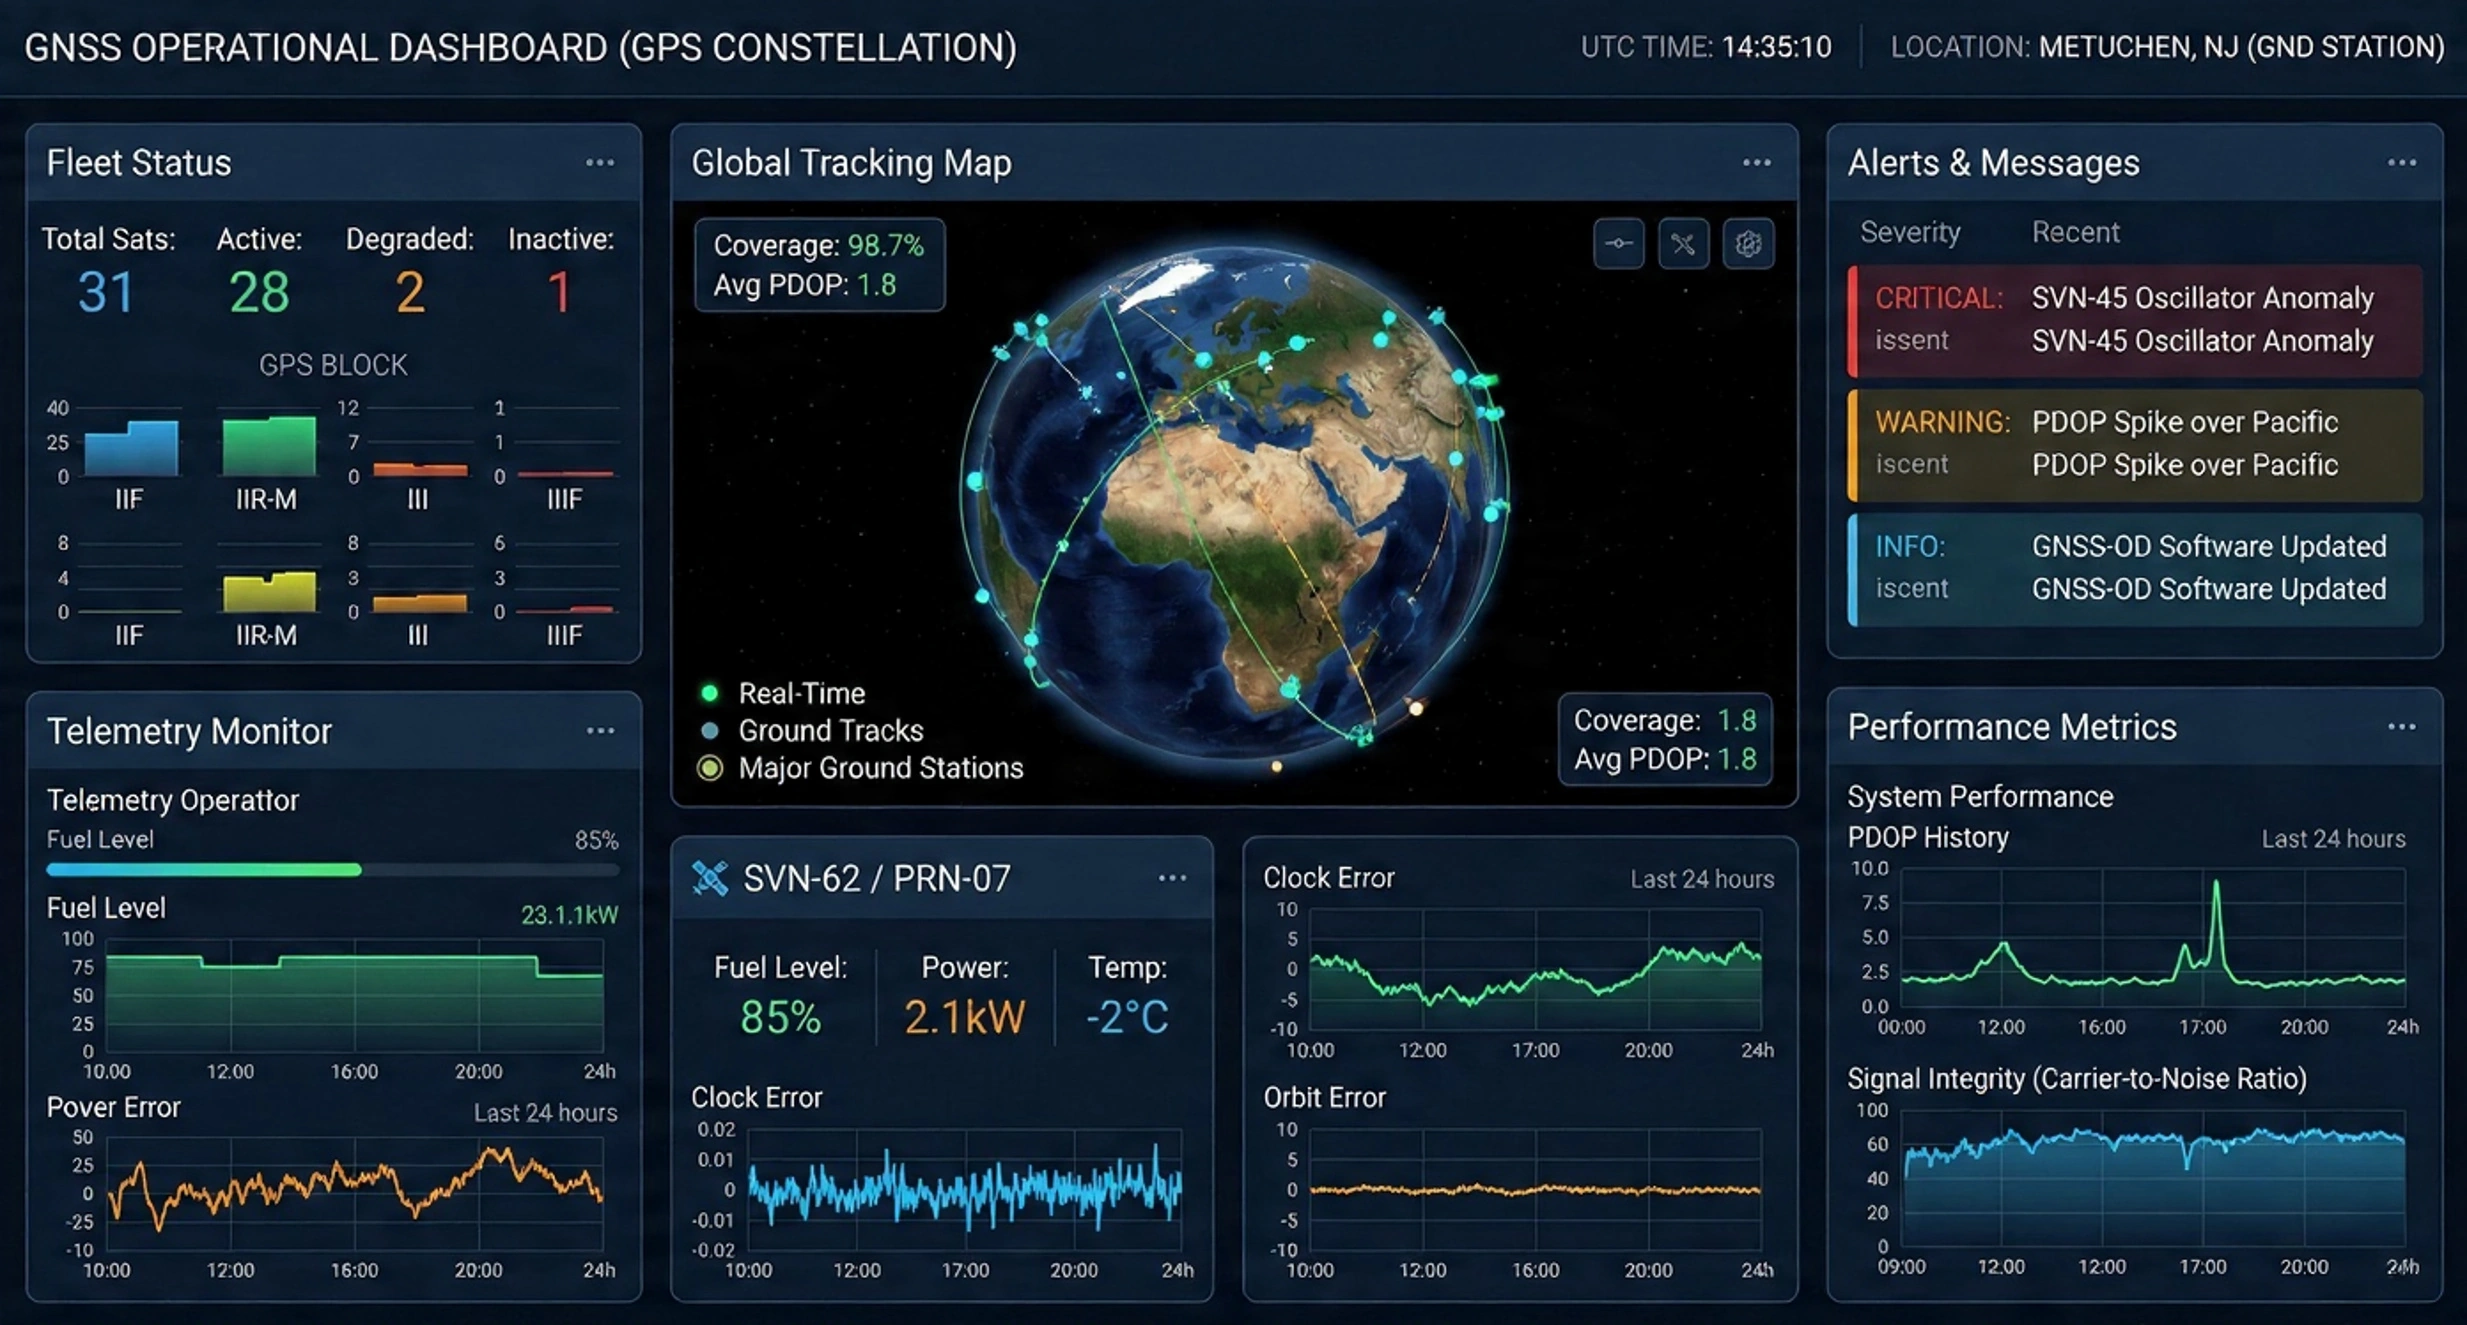
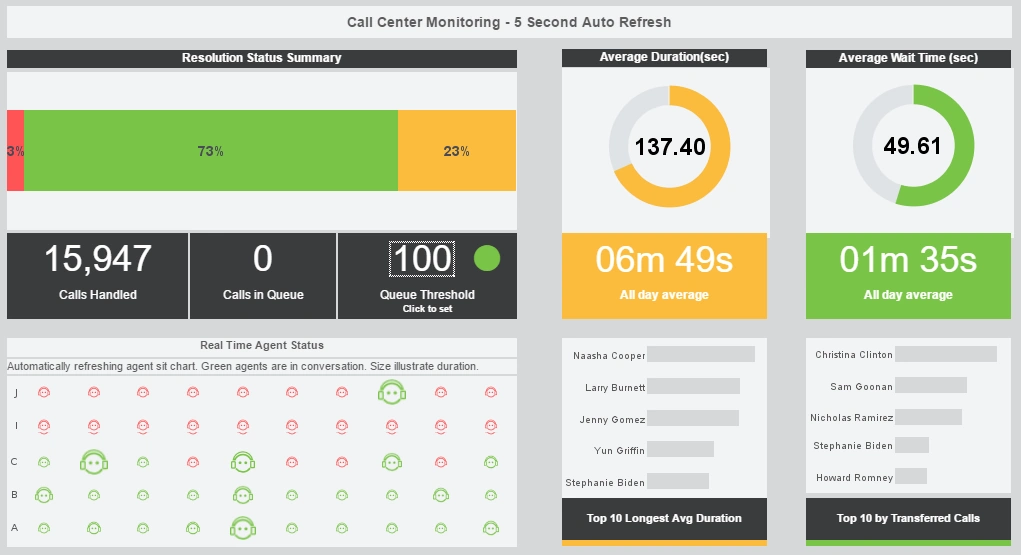
Legacy reporting systems relied heavily on nightly or hourly batch processes. Modern reporting technology increasingly uses streaming pipelines and real-time connectors. This enables dashboards and automated reports to reflect current operational conditions.
Real-time reporting is especially valuable for:
- Operational monitoring
- Customer experience analytics
- IoT and sensor data
- Financial and risk dashboards
By reducing latency, organizations can respond faster and make decisions based on up-to-the-minute information.
Governance, Metadata, and Data Quality
Modern reporting technology places a strong emphasis on governance. With data coming from many systems, organizations need clear rules about who can access what, how metrics are defined, and how data quality is monitored. Metadata management ensures that reports remain accurate and traceable.
Governance features typically include:
- Role-based access controls
- Row-level security
- Data lineage tracking
- Metric definitions and documentation
These capabilities help organizations maintain trust in their reporting environment and ensure compliance with internal and external standards.

Integration With the Broader Data Ecosystem
Reporting tools no longer operate in isolation. They integrate with data lakes, warehouses, ETL/ELT pipelines, and operational systems. This interconnected ecosystem allows organizations to unify data from multiple sources and deliver consistent reporting across departments.
Modern reporting technology supports:
- Direct connections to cloud data warehouses
- Integration with BI and analytics platforms
- APIs for embedding dashboards into applications
- Automated data refresh and synchronization
This integration ensures that reporting is not just a final step but an active part of the data lifecycle.
Deliver Faster, More Accurate, and More Accessible Reporting
The modern reporting technology stack is defined by AI, semantic modeling, real-time data pipelines, and strong governance. These components work together to deliver faster, more accurate, and more accessible reporting across the organization. For anyone searching for “Reporting Technology,” understanding these elements provides a clear picture of how reporting systems are built today and how they continue to evolve. As businesses demand more agility and insight from their data, the reporting technology stack will remain a critical foundation for informed decision-making.

Related Resources About Reporting Technology
Server-side Report Objects - The replet API provides a very powerful way to develop server-side report objects. A report object can be created in a replet using the reporting API or loaded from a report template. If a template does not contain data query information, the report data needs to be programmatically passed in from the replet. A replet can be built from a template with embedded queries. The queries are processed using the InetSoft query engine. When designing a report in the Report Designer and binding data queries to the template, there is no need to write any code to create a replet. The report object information is self-contained in the template. The template can be used directly to create a replet object without using a replet Java class. A report element can be bound to a query defined in the InetSoft Data Modeler (XBuilder). The query binding is used at runtime to retrieve data from data sources and populate the report with the query results. If the report does not need any user interactions, the template can be used directly to create a replet in the repository. The Data Modeler is integrated into the Report Designer in InetSoft products. Data sources and queries can be defined in the Data Modeler window of the Designer. Once a query is created, it can be bound to a report element, such as a table or a chart. The template can be registered with the repository as a replet...

Server-Side Reporting - InetSoft Enterprise products form a Java based server-side reporting system. This system consists of a collection of reusable server components, which can be integrated into other applications and servers, or used 'as is' to provide a complete Java reporting solution. Using the thin client in a server-centric environment has been recognized as a solution to the increasing demand for scalability and reliability of software systems. The use of the thin client also reduces the IT systems administration effort. Many new challenges arise in this shift from the client-server based solution to a server-centric distributed computing environment. First, the traditional GUI based client no longer satisfies users. When it comes to accessing information such as reports, people have come to expect the ability to do so from any browser on a corporate network, without any installation. On the other hand, given the limited functionality of today's HTML/DHTML technology, a GUI based client is still desirable in many situations where more advanced user interaction is required. To solve this dilemma, we designed StyleBI to handle both Java based GUI and standard HTML browser based viewing. With our advanced server reporting API, a report can be viewed from all commonly used web browsers. All user interactions with the report are handled by the report architecture and are transparent to the report developer...
Setting Report Permissions - With InetSoft's reporting software, administrators can set report permissions that govern the access or limitations of specified users. Permissions can be set not only at a report level but also at a component level (Ad Hoc tool, Scheduler, dashboard, Report Explorer, etc.) and at an object level (data models, queries, worksheet assets). Report permissions are set via the Report tab; all other permissions are set via the Objects tab. Permissions for reports are set by selecting the Report tab and then selecting the 'Repository' node from the tree. The 'Repository' is a collection of reports structured into one or more folders. The repository will always have a root folder '/'. All reports and folders are located within this root folder. (Remember: Folders displayed in the repository are logical groupings of reports and do not physically exist on disk. To set the permissions for an individual report or an entire folder: 1. Selecting the report or folder from the tree, and select the Security tab at the bottom of the screen. 2. Deselect the 'Use Parent Permissions' check-box....
Setting up the Report Layout Grid - The report developer can edit the layout grid in a tabular report using one of the following methods: • Inserting new rows or columns into the existing grid. • Deleting rows or columns from the grid. • Splitting a cell into multiple rows or columns. • Merging cells into a single cell. • Drawing a new cell in the grid. All operations are accessible from the cell popup menu. To draw a new cell, follow these steps. Drawing a new cell creates the rows and columns on the grid to accommodate the new cell. It is a shorthand method for adding a cell at a location. A flow-based layout employs a concept similar to a regular word processor. The simplest flow-layout report consists of one element flow. Each element is placed on the output from the top of the page to the bottom. The sequence of elements is processed one by one in the order they are placed in the report. Specifying a page layout for flow reports can modify the flow of the elements. A page layout specification divides a page into multiple page areas. The page areas are ordered in a sequence. The elements flow from one area to the next on the same page, until all areas are full. The printing then advances to the next page. The same page layout will be used for all following pages until a new page layout is specified. For reports having a flow layout, it is possible to specify the orientation (landscape/portrait) for each individual page....
SharePoint Graphical Reporting Tool - Looking for a good SharePoint graphical reporting for your team? InetSoft's pioneering BI application produces great-looking cloud-based dashboards with an easy-to-use drag-and-drop designer. Maximize self-service for business and technical staff. View a demo and try interactive examples...
Simple Reporting Tools - InetSoft makes reporting simple for business users, without sacrificing functionality. With InetSoft's Style Report, reports can be created easily using a simple drag and drop interface. Users with excel-level skills can build and customize their own reports, without help from IT. This reporting process can be fully automated, producing reports at regular time intervals or when certain business conditions are met. Additional functionality, such as drilldown and bursting, enables the specifics in a reports data to be explored. Style Report also includes a charting library with over 30 different chart types, to present organizational data in an intuitively visual way...

Small Business Reporting - InetSoft's Business Reporting Tool is a simple, easy to use software that provides an easy, agile and robust dashboard platform. Its business intelligence software platform, StyleBI, focuses on data mashup and visual business analytics. InetSoft empowers small business users with the combination of powerful authoring tools and a highly scalable deployment environment...
Social Media Reporting Tool for Buffer - Looking for a better reporting tool for Buffer? Go beyond Buffer's own reporting with greater self-service, personalized dashboards for your social media analytics, and and the ability to create data mashups with other organizational data outside of Buffer. InetSoft's pioneering dashboard reporting application produces great-looking web-based dashboards with an easy-to-use drag-and-drop designer. View a demo and try interactive examples...
Software for Database Reports - Do you need to generate pixel-perfect paginated reports for scheduled distribution or self-service drill-down usage via a Web portal? Style Report Enterprise is InetSoft's award-winning reporting application. Do you want to report information in dashboards or scorecards, or want to offer point-and-click visual analysis? StyleBI is InetSoft's leading-edge data visualization application...

Software to Generate Reports - Companies accumulate data at ever-increasing rates, but only advanced reporting can transform undifferentiated data into insight and understanding, driving better decision making and increasing competitive advantage...
What Goes Into a Software Testing and QA Report? - As more and more companies move to digital solutions, among the most important elements for a successful product launch are software testing and quality assurance (QA). Quality control processes create the foundation necessary for building reliable applications. While many elements go into quality assurance, from developing test plans, executing tests, and debugging issues to root cause analysis, each piece helps build confidence in the product when deployed to your customers. But how do you track that progress throughout each step of development? The answer lies in creating and utilizing an effective QA report. The testing phase of a project ensures that a product is high-quality and meets all the requirements. This phase includes manual testing, which is done by a human, or automated testing, where software tools are used to execute tests. Other forms include performance testing, where the system is assessed under various stress levels to determine its capacity limits...
Specifying Report Data Source - It's easy to specify the report data source with InetSoft's reporting software, a multifaceted all-in-one reporting solution that is powerful enough to stand alone and flexible enough to be embedded into complementary programs. The 'Connection Pool' option allows you to specify the type of connection pool to use for JDBC data sources. If you select the 'Application Server' connection pool, the data source names in the data source registry file must match a corresponding JNDI lookup name in your application server. Supported application servers are Tomcat, WebSphere and WebLogic. If you select a 'User Defined' connection pool, you must enter the fully qualified class name of the ConnectionPool implementation in the provided text field, and it must be accessible from the web application's classpath. Note that the 'Application Server' connection pool option will not apply to the Scheduler, as it runs in an independent JVM and cannot access the application server connection pool. You can use a database for persistent storage of the following items. The 'Default DB' field indicates the name of the database schema to be used. If left unspecified, the default database schema for the particular user profile will be used. Once the required information for the database is specified, the connection can be tested by clicking on the 'Test Connection' button...
SQL Client for MariaDB - Looking for a good reporting tool to use with MariaDB? InetSoft's pioneering reporting application creates great dashboards and reports for MariaDB users with an easy-to-use drag-and-drop designer. View a demo and try interactive examples...
SQL Reporting Services Usage - Relational databases are often managed and worked on using the computer language known as Structured Query Language (SQL). Developers may build and distribute reports that assist users in the analysis and interpretation of data using the toolset known as SQL Reporting Services (SSRS), which is built on top of SQL Server. The definition and applications of SQL Reporting Services will be covered in this article. What Is SQL Reporting Services (SSRS)? Users may develop, maintain, and distribute a wide range of reports using SQL Reporting Services (SSRS), a server-based reporting platform. It is a part of Microsoft's SQL Server toolkit and may be used to create reports from a variety of data sources, such as SQL Server, Oracle, and ODBC-compliant databases. Tables, charts, graphs, and maps are just a few of the many report formatting capabilities offered by SSRS. Reports may also have photos, logos, and other branding components added to them...

Staged Flows in Interactive Reports - It is possible to have a parallel flow of multiple stages in a staged parameter sheet. This is desirable when the multiple stages are independent of each other. For example, one stage may have levels Country and State; while another stage may have levels Product Category and Product Name. These two stages are mutually exclusive, and it wouldn’t be logical to place them in a single flow. To add a parallel stage simply drag an element to the region titled ‘Drag here to add a flow’ on the right of the Staged Parameter dialog box. Elements in the ‘Default Level’ are always enabled. A visual interface is provided through which you can add multiple parameter sheets and control the sequence of prompting. Using a simple GUI you can specify conditional branching of parameter sheets, i.e., the parameter sheet to be displayed next in the sequence is decided on the fly based on user inputs. We will now explore a sample scenario where this functionality is useful. Although it is possible to accomplish parameter chaining on the same parameter sheet through the use of staging, the use of multiple parameter prompts allows each to be reused independently...
Startups Select InetSoft's Reporting Tool - Looking for the best startup reporting tool? InetSoft partners with entrepreneurs to embed it flexible dashboard reporting application, including options for no up-front license investment costs. Solution providers get great-looking web-based dashboards with an easy-to-use drag-and-drop designer. View a demo and try interactive examples...
Status Reporting Tool - Looking for status reporting tools? InetSoft is a pioneer in self-service reporting and makes it easy to create status dashboards and report. View a demo and try interactive examples...
Status Reporting Tool for Teams - Looking for a status reporting tool for your team to read out on status and performance? InetSoft is a pioneer in reporting with 5,000+ customers since 1996. The web-base platform offers the most flexible pixel-perfect reporting platform for report distribution. View a demo and try interactive examples...

Statutory Reporting Software - Looking For a Software for Statutory Reporting? InetSoft’s StyleBI features a state-of-the-art reporting engine that allows for the easy creation of pixel-perfect paginated reports that can meet the reporting specifications of any regulatory agency...
Structured Reporting - StyleBI gives you production-grade report development with the desktop Report Designer tool. The following sections walk you through creating and saving a new report. For complete information about report design, see the Report Designer. Before creating a new report, you will need to choose one of two layout types, flow layout or tabular layout. The tabular layout is best suited to reports that have rectangular partitions, like a web page using a table for layout. The flow layout is often used for brochure-like reports with multiple columns or fixed panels. If your new report is going to be one of a series of similar reports with common features, you may want to first create a “meta-template,” and then use that meta-template to create the new report. Otherwise, you can just create a stand-alone report, as you will do in the following example. In the following example, you will create a simple sales report, starting with a 'Blank Tabular Report'. Then you will add some report elements to display data and other report information. Follow the steps below...