Geosynthetics Installation Firm Switches From Whatagraph To Inetsoft For Reporting
In the geosynthetics installation industry, data lives everywhere: field crews capturing installation progress, quality teams logging seam tests and pullout strengths, project managers tracking change orders, and compliance specialists documenting every liner, anchor, and weld.
For years, one mid‑sized geosynthetics installation firm, GeoLine Systems, relied on Whatagraph to turn this scattered information into client‑facing reports.
The tool handled basic marketing‑style summaries and simple dashboards, but as GeoLine’s projects grew in complexity and regulatory scrutiny, the cracks in their reporting stack began to show.
The company eventually made a strategic decision to migrate from Whatagraph to InetSoft, reshaping how it generates, governs, and delivers reports across its operations.
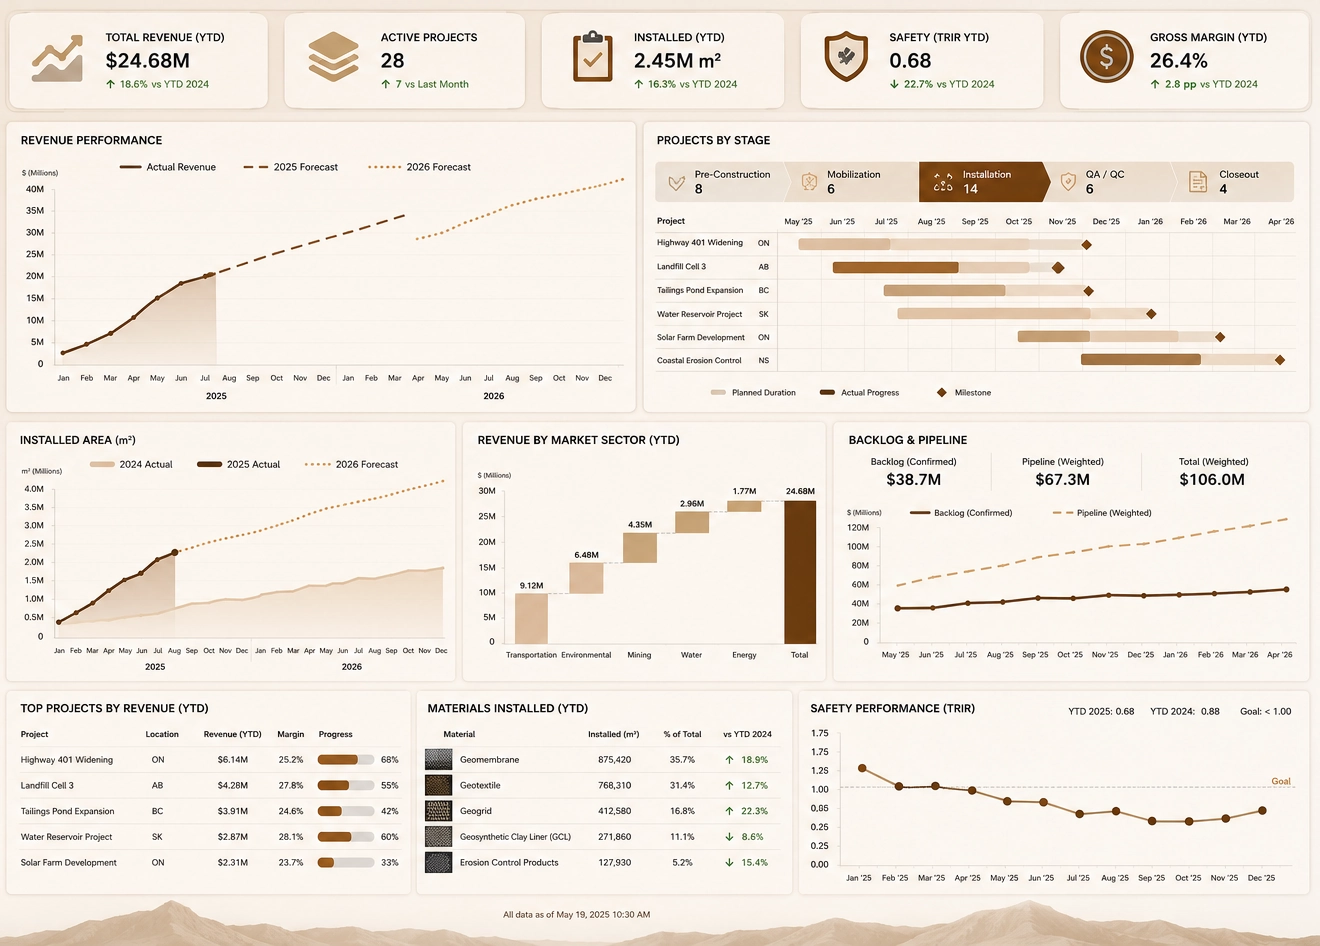

GeoLine Systems specializes in the installation of geomembranes, geotextiles, geogrids, and geocomposites for landfills, mining tailings ponds, stormwater basins, and large civil infrastructure. Their work is largely invisible—buried under soil, concrete, and water—but every project demands meticulous documentation. Each liner panel, weld, destructive test, non‑destructive test, and repair must be recorded, traced to a location, and tied to a project specification. Clients expect daily progress summaries, quality assurance reports, and final as‑built documentation that can withstand regulatory audits years later.
Initially, GeoLine treated reporting as an extension of its marketing and client communication workflows. Whatagraph, designed primarily for aggregating digital marketing metrics, was repurposed to pull data from spreadsheets and a few cloud systems, then present them in visually appealing dashboards. For small projects, this was “good enough.” But as the firm took on multi‑site landfill expansions and high‑risk mining containment projects, the limitations of this approach became impossible to ignore.
Limitations Of Whatagraph In A Technical, Compliance‑Driven Environment
The first major issue was data structure. Geosynthetics installation data is not just counts and trends; it is deeply relational. A single weld record might reference a liner roll ID, panel number, GPS coordinates, technician ID, test results, and specification thresholds. Whatagraph could display numbers and charts, but it lacked the ability to model complex relationships or enforce consistent business logic across reports. Each dashboard became a custom build, with formulas embedded directly in widgets and little reuse from project to project.
The second issue was governance. GeoLine needed strict control over who could see which projects, which data fields, and which derived metrics. Field supervisors should see operational dashboards; clients should see curated views; regulators should receive pixel‑perfect PDFs with locked layouts. Whatagraph’s permission model and export options were oriented toward marketing teams, not engineering and compliance workflows. As a result, the firm relied heavily on manual exports, spreadsheet manipulation, and ad hoc formatting in tools like Word and PowerPoint.
Third, the firm struggled with scalability. Every new project meant another round of custom dashboard creation, often involving manual data preparation. When a client requested a new KPI—such as daily installed area versus planned, or defect rate per crew—analysts had to retrofit existing dashboards, risking inconsistencies and errors. Over time, the reporting environment became fragile, with different versions of “the truth” scattered across multiple Whatagraph workspaces.

Why Inetsoft Emerged As The Preferred Reporting Platform
GeoLine’s leadership team initiated a review of reporting platforms with three core requirements: stronger data modeling, better governance, and support for both interactive dashboards and formal, production‑grade reports. InetSoft quickly stood out because it treats reporting as a first‑class discipline, not just a visualization layer. Its data mashup capabilities allowed GeoLine to blend installation logs, QA/QC databases, project schedules, and ERP data without forcing everything into a rigid warehouse upfront.
Equally important, InetSoft separates data logic from presentation. GeoLine’s analytics team could define reusable data blocks representing concepts like “Installed Area By Day,” “Defect Rate By Crew,” or “Test Results Versus Specification,” then reuse these across multiple dashboards and reports. This eliminated the metric drift that plagued their Whatagraph environment, where similar charts sometimes produced slightly different numbers due to duplicated formulas.
InetSoft also offered robust support for pixel‑perfect reporting. For geosynthetics projects, final documentation is not optional; it is a contractual and regulatory requirement. With InetSoft, GeoLine could design highly structured reports—complete with tables, diagrams, and signatures—while still leveraging the same underlying data logic used in interactive dashboards. This unified approach meant that daily operational views and final as‑built packages were always aligned.

Migration Journey From Whatagraph To Inetsoft
The migration began with an inventory of existing Whatagraph dashboards and reports. GeoLine categorized them into three groups: client‑facing progress summaries, internal operational dashboards, and formal QA/QC documentation. For each category, the team identified the underlying data sources, transformation logic, and recurring KPIs. This exercise revealed just how much logic was embedded directly in Whatagraph widgets and spreadsheets, making it difficult to maintain consistency.
Using InetSoft, the team rebuilt core data flows as centralized mashups. Installation logs from field tablets, weld test results from the QA database, project schedules from the planning system, and cost data from ERP were all connected into a unified reporting layer. Data blocks were defined for key entities—projects, panels, welds, tests, crews—and for derived metrics like productivity, defect rates, and compliance status. Once this foundation was in place, building dashboards and reports became a matter of assembling visual components rather than reinventing logic.
GeoLine then focused on replicating and improving its client‑facing views. Daily progress dashboards were redesigned to show installed area by zone, open issues, and upcoming milestones, with drill‑downs into specific panels and welds. Clients could access these dashboards through a secure portal, filtered to their projects only. At the same time, the QA team used InetSoft’s reporting tools to generate detailed test result summaries, including tables of destructive and non‑destructive tests, failure rates, and corrective actions.
The final phase involved replacing manual, document‑heavy workflows. Instead of exporting charts from Whatagraph and pasting them into Word, GeoLine created fully automated report templates in InetSoft. These templates pulled live data, applied standardized layouts, and generated PDFs ready for submission to regulators and project owners. Scheduling and bursting features ensured that the right reports reached the right stakeholders at the right time, without manual intervention.
Operational And Strategic Benefits After The Switch
The impact of the migration was felt quickly. Project managers reported a significant reduction in time spent assembling weekly reports, freeing them to focus on planning and risk management. QA teams gained confidence that their metrics were consistent across dashboards and formal documentation, reducing the risk of discrepancies during audits. Field supervisors appreciated the ability to see real‑time productivity and defect trends, helping them adjust crew assignments and training.
From a governance perspective, InetSoft’s role‑based access and embedding options allowed GeoLine to create tailored experiences for different stakeholders. Internal users saw rich, exploratory dashboards; clients saw curated views; regulators received structured, compliant reports. All of this was driven by a single, coherent data logic layer, reducing confusion and rework.
Strategically, the firm discovered that better reporting could be a competitive differentiator. During bid processes, GeoLine showcased its InetSoft‑powered reporting capabilities as part of its value proposition: transparent progress tracking, robust QA/QC documentation, and long‑term data retention. Clients appreciated the clarity and reliability of the reports, and several cited reporting quality as a factor in awarding contracts.

Looking Ahead: Reporting As A Core Capability
By switching from Whatagraph to InetSoft, GeoLine Systems effectively redefined reporting from a peripheral marketing‑style activity into a core operational capability. In the geosynthetics installation industry, where projects are complex, risks are high, and documentation is critical, this shift matters. InetSoft gave the company the tools to model its data accurately, govern access responsibly, and deliver both interactive insights and formal reports from a single platform.
As GeoLine continues to expand into new markets—such as coastal erosion control and large‑scale stormwater infrastructure—it plans to extend its InetSoft environment with additional dashboards for environmental performance, long‑term asset monitoring, and predictive maintenance. The migration away from Whatagraph was not just a tool swap; it was a strategic move toward a reporting ecosystem that can grow with the business, support compliance, and strengthen client trust in every buried liner and hidden weld.