Information about InetSoft's Software for Enterprise Dashboards
If you're looking for an easy-to-learn tool for enterprise dashboards, evaluate InetSoft's free and commercial applications. With InetSoft software, you can create brilliant charts, graphs and other visualizations with just a few clicks of your mouse. Drill down to see exactly the information you need, or build performance dashboards for sharing with anyone. These pages pertain to InetSoft's enterprise dashboard software:
Visualization Dashboards - Remember when people used to use that old term 'crunching the numbers'? Back in those days the numbers were mostly all you had to look at. Luckily, InetSoft's visualization dashboards allow you to view information in ways that are far easier to process. All data view elements are listed under the ‘Toolbox > Data View’ node of the Component tree. To create a table by dragging a data block follow these steps: 1. Select a complete Data Block in the Component tree. 2. Drag the entire Data Block directly onto the Viewsheet grid. To create a table with the table element follow these steps: 1. Drag a Table element from the Component tree into the Viewsheet grid. This creates an empty table element. 2. Expand a Data Block node in the Component tree, and drag and drop one or more columns onto the Table element. 3. Repeat to add additional columns. A green highlight on the Table indicates where the dragged columns will be placed...
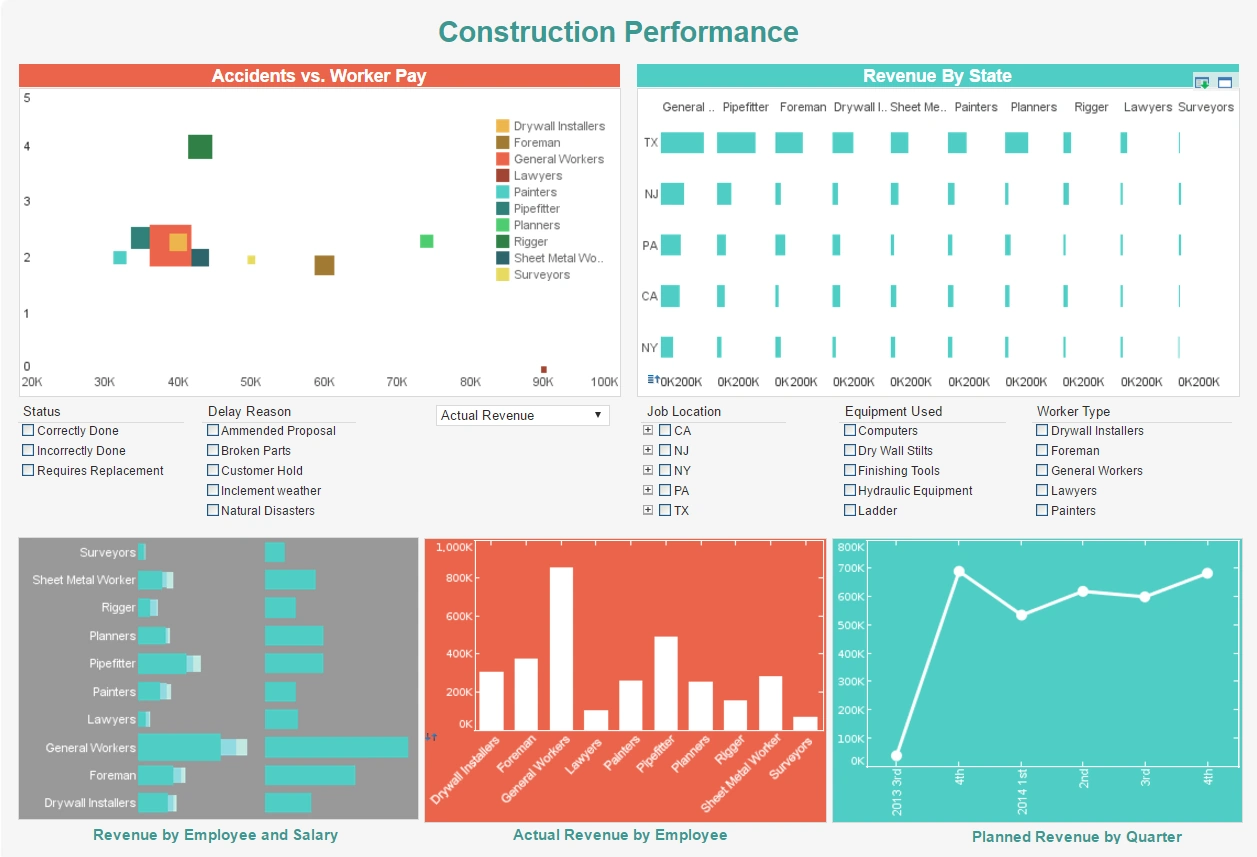
Visualization Dashboard Examples - Visualization dashbaords can help your business get to the next level. With the aesthetically pleasing look, combines with the in depth analysis that a visualization dashboard gives, it allow employees at any level the abiility to interpret how their department s doing. Upper management can now streamline the way different departments operate business on a daily basis, by pointing out the areas that are trending upward and those that are trending downward. Using dashboard examples can give your company a strategic edge when it comes to its Business Intelligence solutions. Dashboard examples allow to companies to convert key numerical business data into graphical/visual representations that are easy to read and understand. Visualization dashboards produce easy to read interpretations of business data, that are intended to help your business grow...
Visual Exploration - Exploration is the key to the discovery of knowledge, and StyleBI’s advanced dashboards allow end-users to freely probe and experiment within an easy-to-use, self-service environment. Users can inspect their data from a variety of angles, test and validate analysis methods, and simulate hypothetical business scenarios – all without the assistance of IT staff. Consider some of the common problems that business users face: • “I need to analyze data obtained from different sources in real-time, e.g., data from an Excel spreadsheet and an Oracle database.” • “I need to analyze live operational data, as well as historical data.” • “I want to view selected portions of my data, without having to continuously resubmit a set of parameters to generate new reports.” • “I need to analyze my data, and I understand the business, but I have no knowledge of how the data is stored.” • “I need to perform an interactive “What-If ” analysis on my data, i.e., change the inputs to test a hypothetical scenario...
Visual Exploration with Dashboards - StyleBI dashboards, called Viewsheets, encourage end-users to freely explore and experiment. Viewsheets guide users toward asking the right questions, questions that will return valuable and actionable information. This section focuses on how end-users can interact with a sample dashboard to generate new knowledge. To create the sample dashboard, see Creating a Viewsheet Asset. 1. Launch the Visual Composer by clicking Start → All Programs → StyleBI → StyleBI Examples. 2. Select the ‘User Portal’ link. This opens the Report Portal. 3. In the Report Portal, select the Report tab. 4. In the left pane of the Portal, expand the ‘Repository’ tree and the ‘My Reports’ node. Click the ‘Sample Viewsheet’ to open this dashboard. You can interact with the viewsheet by manipulating the graphical controls; this viewsheet has a Selection List, Time Slider, and Table. • The Selection List lets you to specify the states whose data you wish to analyze • The Range Slider lets you focus on a specific time period. The period can be as short as two months or as long as the full available range...

Visual Reporting API - GraphElement.setSizeFrame(frame) specifies the size of graphical elements. A SizeFrame can size-code chart elements by value, or simply specify a static size. GraphElement.setTextFrame(frame) Specifies the data values to be displayed on the chart elements as text, as well as the mapping between element values and displayed text. GraphElement.setTextSpec(spec) Specifies the text attributes such as color, font, format, etc. The IntervalElement object contains the visual elements for bar charts and range visualization. To create a new IntervalElement object, call the IntervalElement constructor. You can pass a set of fields as input to the constructor (e.g., 'State', 'Quantity'), or specify these later using the addDim() and addVar() methods...
Visualization API - IntervalElement.addInterval(lower,upper) adds a “floating” interval element (bar) with lower and upper values specified by the inputs. IntervalElement.setStackGroup(boolean) Specifies whether each element group (i.e., bar series) should be stacked independently, or whether all should form a single stack order. IntervalElement.setStackNegative(boolean) Specifies whether negative and positive values stack independently on opposite sides of the axis, or whether stacking is cumulative (i.e., determined arithmetically). The LineElement object contains the visual elements for a line chart. To create a new LineElement object, call the LineElement constructor. You can pass one, two, or three field names (e.g., 'State', 'Quantity') to the constructor, or specify these later using the addDim() and addVar() methods...