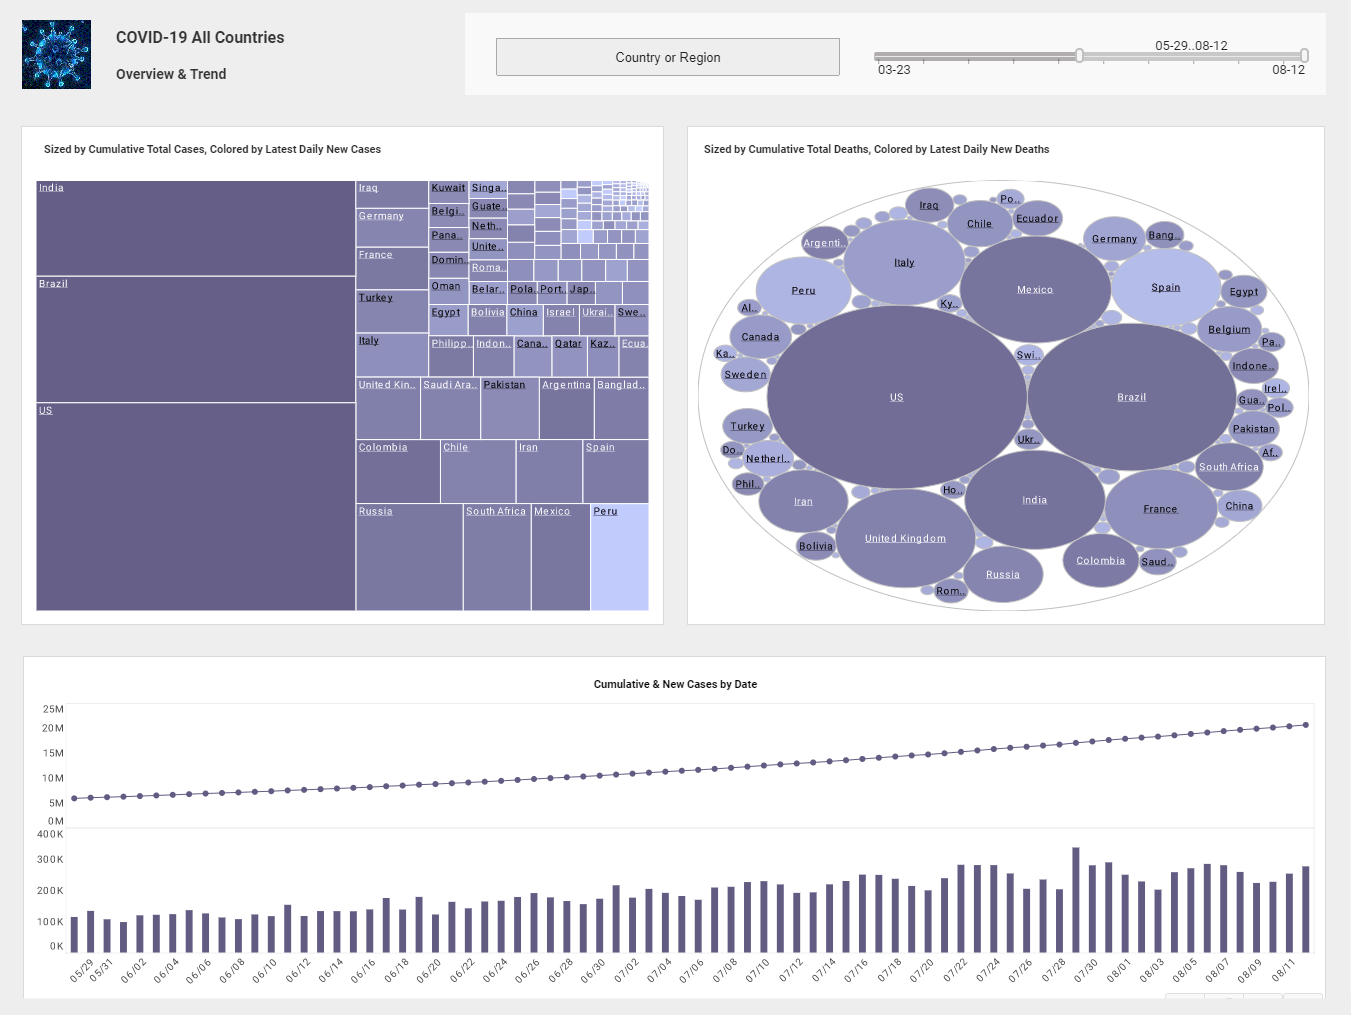
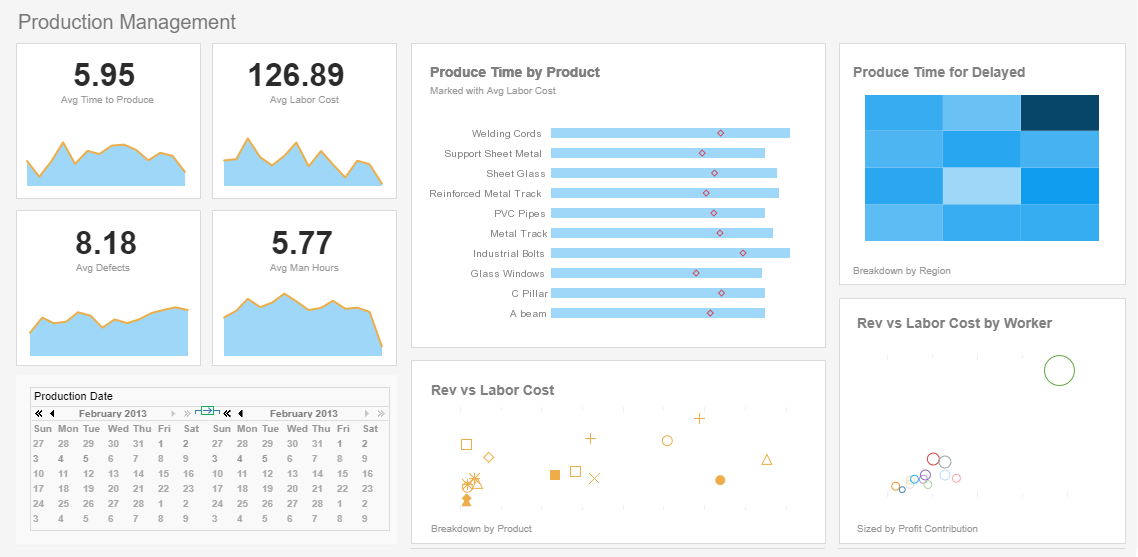
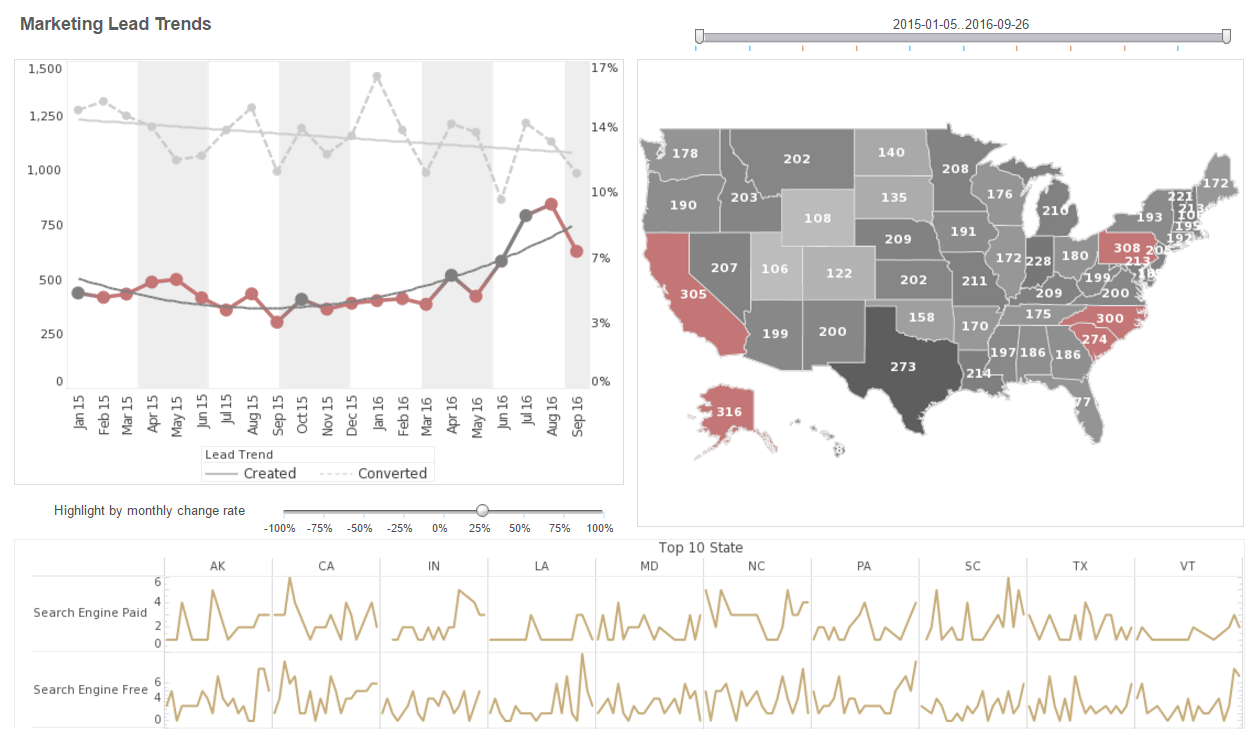
InetSoft's Business Intelligence API
Business applications can interface with end users either through a graphical user interface (GUI), a thin client (usually a web browser) or an exported report (PDF, RTF, Excel etc).
Developers can use the JFC libraries, Swing or a large number of commercial GUI component libraries to build sophisticated, platform-independent, internationalized GUIs. Alternatively, developers can use web programming with JSP’s and/or servlets to develop ‘thin client’ applications.
InetSoft supplies a Java reporting tool set to facilitate business report application development in a Java environment. These API Java tools are provided in a family of three products, namely Style Report Enterprise Edition, StyleBI, and StyleBI.

The Power of StyleBI
Our BI product set provides features that allow developers to easily create report applications capable of presenting business reports to end users through any of the three channels mentioned above.
The InetSoft product set offers tremendous flexibility to support a range of application development philosophies, from “heads down, hands on” coding (programmatic), to the use of high-level intuitive and visual report development and server administration tools. End users are empowered with maximum self-service capability.
If necessary, it is possible to combine the use of the high-level tools with the programmatic approach, thus utilizing the best of both worlds. This degree of flexibility means that developers do not compromise between power and flexibility or ease of use.
The recommended approach for report development with InetSoft products is to use the high-level report development tools, since this method significantly speeds up and simplifies implementation. Only use the reporting Java API when absolutely necessary. In the Enterprise edition and up, tools are included to create server side reports, managed in a centralized repository.
Design Philosophy
By providing a choice between using a visual report design tool, a finely tuned API or a combination of the visual and API approach, the software package gives programmers ultimate control. Style Report includes the following features:
- Connectivity to relational databases (JDBC), multidimensional databases, XML, SOAP, Java beans (POJO), Microsoft Excel, flat files, OLAP cubes, SAP, PeopleSoft, JD Edwards, salesforce.com, Siebel CRM, and many more.
- Ability to export a report to a variety of file types including pdf, postscript, html, csv, rtf and Excel.
- Easy to use visual report template designer.
- Report scripting based on standard JavaScript.
- Over 80 pre-built table styles to choose from.
- Full support for page formatting and pagination.
- Enterprise Edition and up boasts a web-based servlet, RMI, and server clustering.
With built-in support for a wide range of visual tables and pre-built table styles, printing a professional looking report is a simple process. Although InetSoft products include a large number of ready-to-use table styles and adapters for printing many types of data, the extensibility of the software was not sacrificed. Due to the object-oriented design of InetSoft software, users can easily extend the software to support new data sources, create new styles, print new widgets and more.
As a Java programmer’s toolkit, InetSoft products fully support platform independence and internationalization. The software does not use any native or non-portable code. It is written in 100% Java code and is built on top of the basic platform independent printing provided by the Java AWT system.
What Does a Cloud Developer Need in an API for Creating BI Dashboards?
A cloud developer building dashboards typically requires a robust API (Application Programming Interface) to facilitate the creation and management of these visual interfaces. Here are some key features and functionalities that a cloud developer might look for in an API for creating dashboards:
-
Data Integration and Connectivity
- Ability to connect to various data sources, including databases, cloud storage, APIs, and other data services.
- Support for real-time data streaming or batch processing to keep the dashboard updated with the latest information.
-
Data Transformation and Querying
- Tools for data cleaning, transformation, and aggregation to prepare it for visualization.
- A querying language or interface for extracting specific subsets of data from the source.
-
Visualization Components
- A wide range of customizable charts, graphs, tables, and other visualization elements to represent the data effectively.
- Support for different chart types (e.g., bar charts, line charts, pie charts, heatmaps) and interactive features (e.g., tooltips, drill-downs).
-
Dashboard Layout and Design
- Flexible layout options to arrange and organize visual components on the dashboard canvas.
- Customizable themes, color schemes, and styling options for a cohesive and branded look.
-
User Interaction and Interactivity
- Ability to add interactive elements like filters, dropdowns, date pickers, and buttons for user-driven exploration of data.
- Support for user-defined parameters to dynamically update the displayed information.
-
Real-Time Updates and Alerts
- Capability to incorporate real-time data updates and push notifications to ensure that the dashboard reflects the most current information.
- Alerting mechanisms for notifying users of specific conditions or thresholds being met.
-
Security and Access Control
- Authentication and authorization features to ensure that only authorized users have access to specific dashboards or data.
- Role-based access control (RBAC) to define different levels of permissions for different user roles.
-
Embedding and Integration Options
- Ability to embed dashboards within other applications, websites, or portals for seamless integration into existing workflows.
- Support for embedding APIs or SDKs to extend functionality within external applications.
-
Performance Optimization
- Efficient data retrieval and processing mechanisms to ensure that the dashboard loads quickly and responds smoothly, even with large datasets.
-
Documentation and Support
- Comprehensive documentation, including API reference guides, tutorials, and examples, to facilitate easy integration and development.
- Access to a support system or community forums for assistance in case of issues or questions.
-
Scalability and Performance Monitoring
- Scalability features to handle a growing number of users and data volumes.
- Monitoring tools or APIs to track the performance of the dashboard and identify areas for optimization.
-
Customization and Extensibility
- Ability to extend functionality through custom code or scripting languages for unique requirements not covered by built-in features.
More Resources for BI API Users
Accessing Chart Data Via an API - You can access Chart data in script by using the "dataset" object. The dataset object contains the aggregate values displayed on the chart (the same values shown by the 'Chart Data' button). The Dataset object is accessible as a two-dimensional array, where each column represents a distinct dataset (measure). For example, consider a chart with two datasets (measures), as shown below: As is typically the case, each value plotted on the graph represents an aggregation of many detail records. The Dataset object provides access to these aggregate values...
API for Visual Reporting - Below are some examples of Visual Reports generated by InetSoft's Visual Reporting API. And following is documentation on using InetSoft's JavaScript-like API for programmatically generating charts. Alternatively use InetSoft's drag-and-drop chart designer...
Evaluate InetSoft's Alternative for Datapine's Dashboard Application - Are you looking for a good alternative to Datapine's dashboard application? InetSoft's pioneering dashboard reporting application produces great-looking web-based dashboards with an easy-to-use drag-and-drop designer. Get cloud-flexibility for your deployment. Minimize costs with a small-footprint solution. Maximize self-service for all types of users. No dedicated BI developer required. View a demo and try interactive examples...
Two Report Layout Models - InetSoft reporting uses two report layout models, namely tabular layout and flow layout. Tabular layout divides the report layout area into cells on a grid. Report elements are added one by one to specific cells on the grid. With Flow layout, the report elements are added as a continuous flow, one after another, similar to a regular word processor...
User-Defined Conditions for Report Scheduling - It is possible to define custom schedule conditions by using the schedule API. The user-defined conditions cannot be entered directly on the Enterprise Manager, but must be created programmatically. A user-defined condition must implement the UserCondition interface. There are a few methods in the interface: check(), getRetryTime(). Both methods take a current time parameter. The current time parameter specifies the logical current time...
Using an API to Change Chart Scaling - A Scale object determines how abstract data values are mapped to physical chart representations such as position, color, shape, etc. The EGraph object and the VisualFrame object both map data values to physical representations, so both of these objects require a Scale..
Using a Server Report API to Generate Web-based Reports - InetSoft Enterprise products are based on the report engine from Style Report Enterprise and share the same Object Oriented design approach. To address the requirements of a distributed computing environment the InetSoft advanced server report API allows a single report to be viewed from any browser...
Why Choose InetSoft's API for Reporting? - InetSoft's API enables the flexibility for organizations to create a unique web interface for business reporting needs. OEM, cloud application providers and developers can optimize InetSoft's robust reporting capabilities though their own web portals or applications, with whatever look or design that they choose...
White Paper for Integrating Spark into a BI Application - To avoid the aforementioned problems, the key is to break down the barrier between Spark and the BI tool. Instead of relying on the JDBC/ODBC interface, we completely fused Spark into Style Intelligence. The following is a high-level view of the integration...


