Searching For Good Management Dashboard Examples?
Below are some good examples of management dashboards. A management dashboard can be looked at as an executive tool whose sole purpose it to make information easier to read. These dashboards can include a variety of different types of data, which can all be integrated into an easy to read dashboard. Good management dashboards allow users to seamlessly transition from one graph to another, without losing any important data.
In order to gain the competitive edge in a particular market, your business needs to be able to read, track, and convert the data that is constantly changing everyday. These interactive dashboards control every aspect of your business. Whether you need to keep track of daily expenses, monthly inventory reports, or quarterly earning, a good management dashboard can help do that.
To distinguish itself from others, a good management dashboard will give you the ability to track three key components of your business:


Run the Business Effectively and Efficiently
Management dashboards provide particular information that businesses need in order to run effectively and efficiently. This information is presented in graphical, easy to read charts that display the data that the business specifically incorporates in to the graph. This means that the manager of a store can use these management dashboards and design them specifically to his or her business. In most cases, management dashboards combine different elements such as metrics and KPI's, on one single graph to give you an overall picture of how sales are going, or how much inventory is left in the store. These particular dashboards are created in order to be flexible with whomever is using it. There is no right way to use a management dashboard. The idea is to cater them to your business.
With InetSoft's unique drag and drop dashboard design, you are able to fully customize reports geared toward your specific business. You have full control over with metrics and key performance indicators (KPI) that you wish to choose, and are able to combine and conform them to meet your growing business needs.
Click the images below to interact with the live dashboards and gain a better understanding of what management dashboards can do for your business:
Product Returns
Marketing Project Management
Production Management
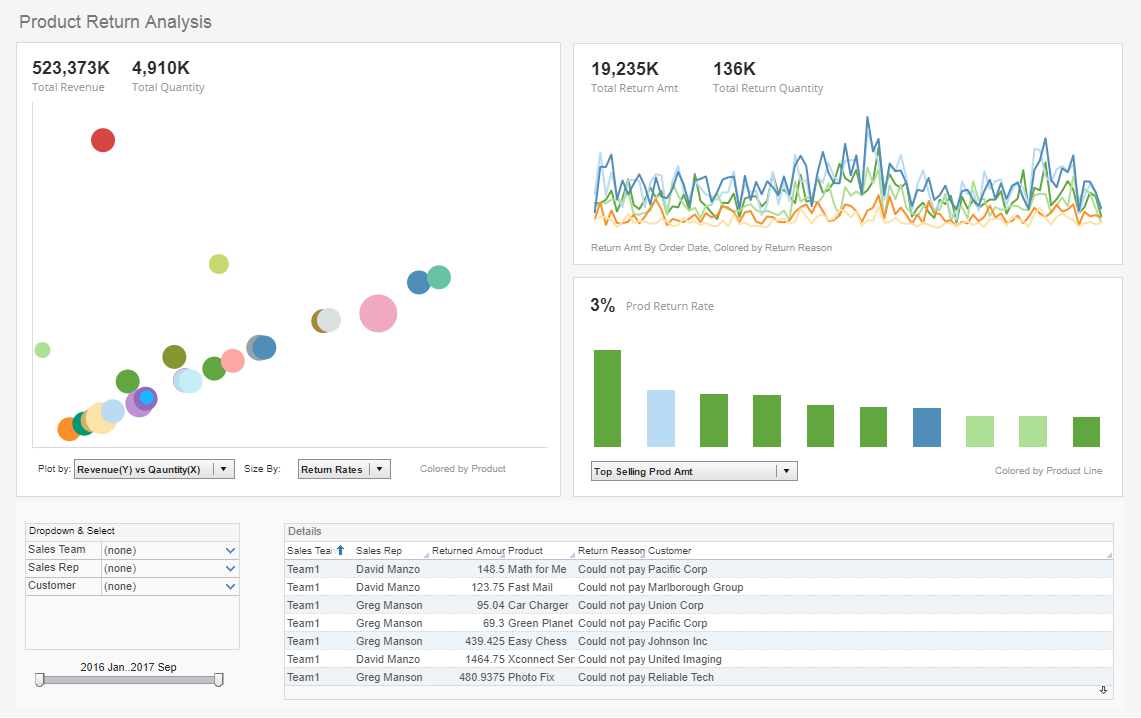
This product returns dashboard gives inventory managers an idea of their strongest and weakest product lines, as well as the performance of sales teams. The bubble chart is a great example of how size can be incorporated as a third dimension, with dropdown lists giving options for swapping in other fields as well.
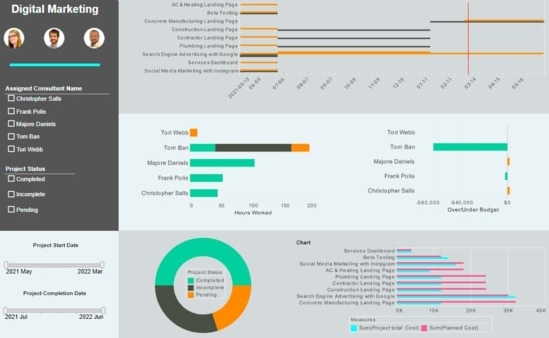
This dashboard helps digital marketing agencies track the progress of their consultants on various initiatives. A Gantt chart tracks the start and end date of various projects, giving a visual representation of project durations.
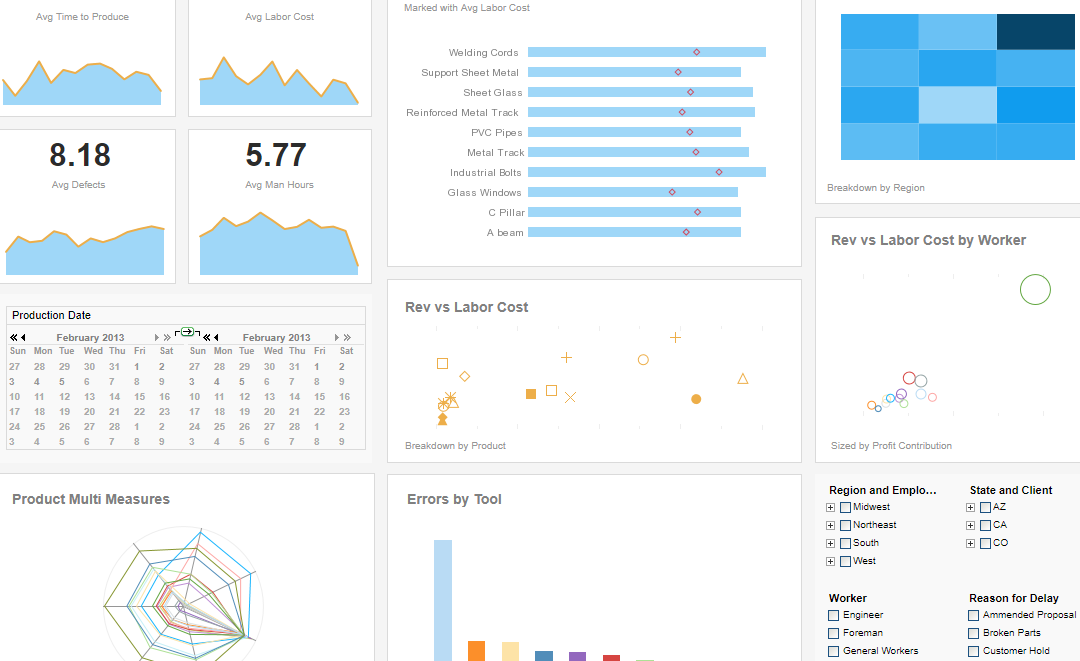
With this production management dashboard, manufacturing managers can monitor production times, errors, and production costs. Text KPI's in the top left corner give an at a glance picture of the factory's overall performance.
Work Order Summary
HR Employee Retention
Supply Chain
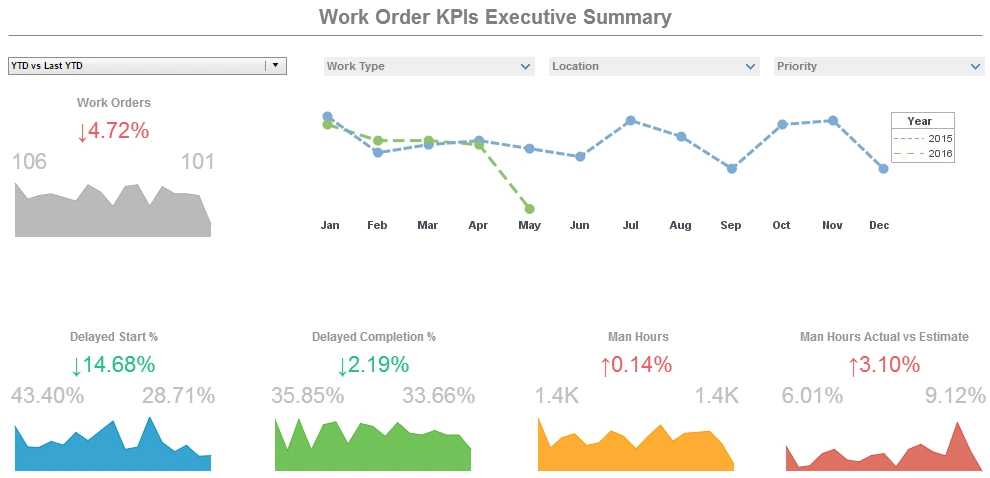
This work order summary dashboard shows executives how maintenance orders are progressing in relation to goals. Hovering the mouse over fill charts causes popup bar charts to appear, breaking down work orders by priority and type of task.
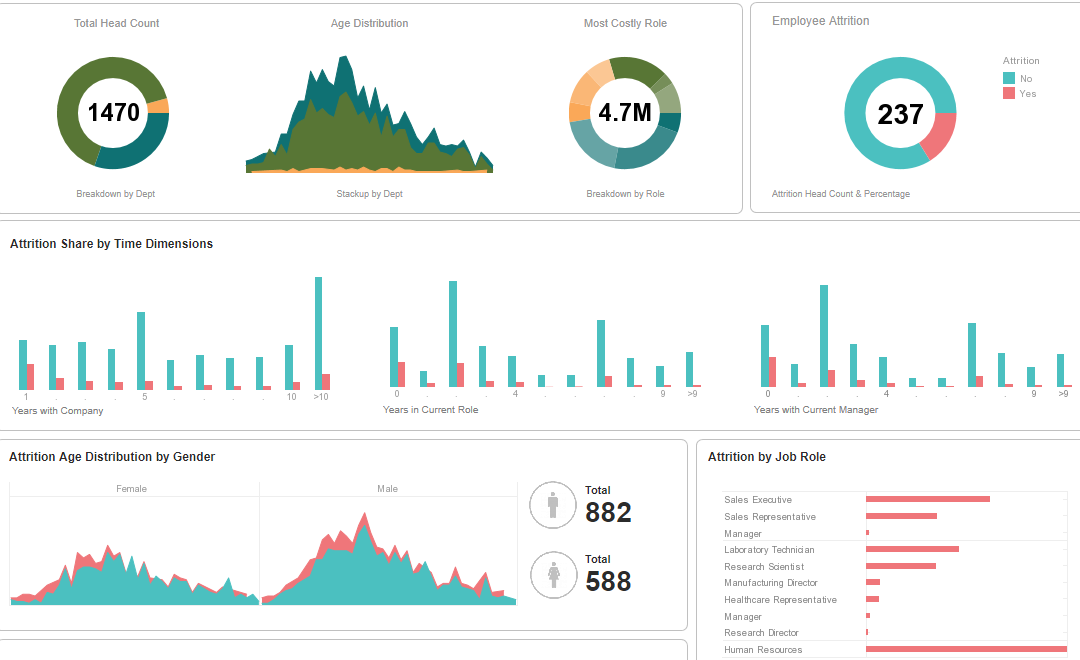
This dashboard helps give HR managers an overall picture of the factors that contribute to employees leaving the company. A tree chart displays the proportional attrition rate among the different VP positions.
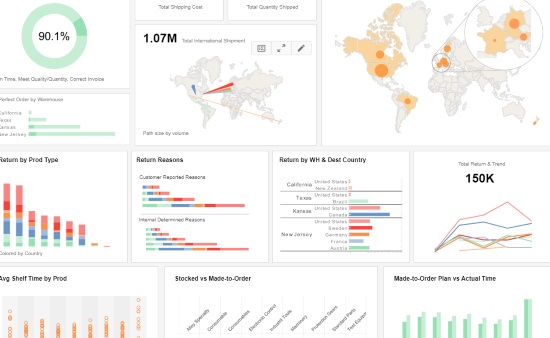
This supply chain dashboard gives an overview of global shipments and returns. Charts detailing return by product type and reason help supply chain managers formulate strategy for reducing returns and increasing customer satisfaction.
Retail Store
Harvest Billing
Global Logistics
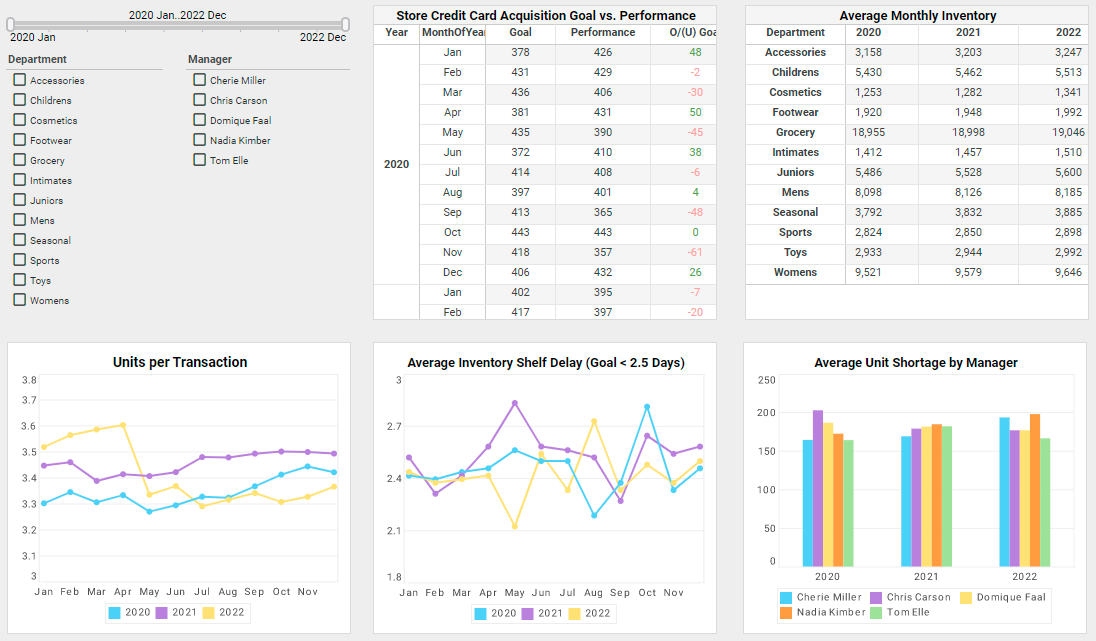
This retail store dashboard helps manage all aspects of retail, including sales, inventory, payroll, and even store credit card acquisitions. A red/green highlight indicates whether said acquisitions were above or below goal.
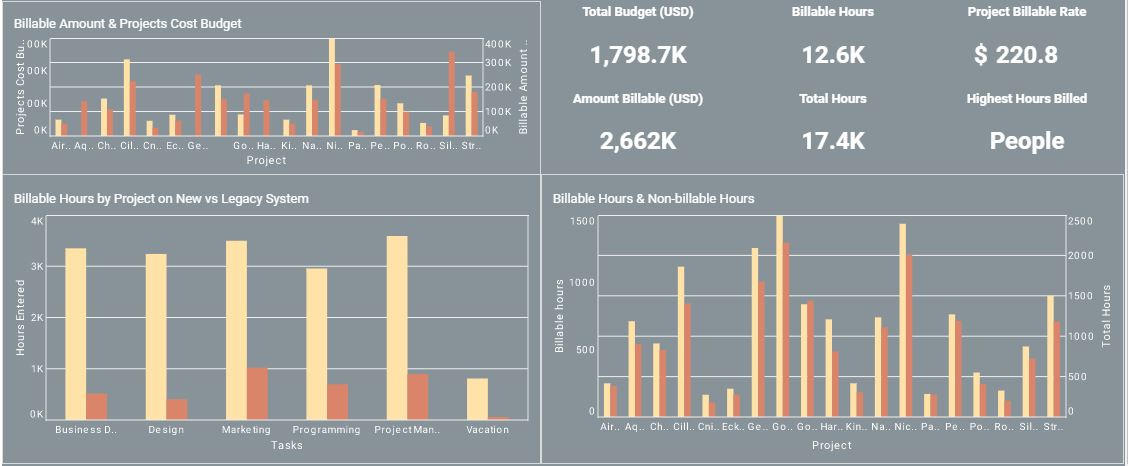
This dashboard draws data directly from the Harvest billing system, to give a breakdown of billable hours by client and rate. Date sliders controlling start and end dates help managers drill down into the data.
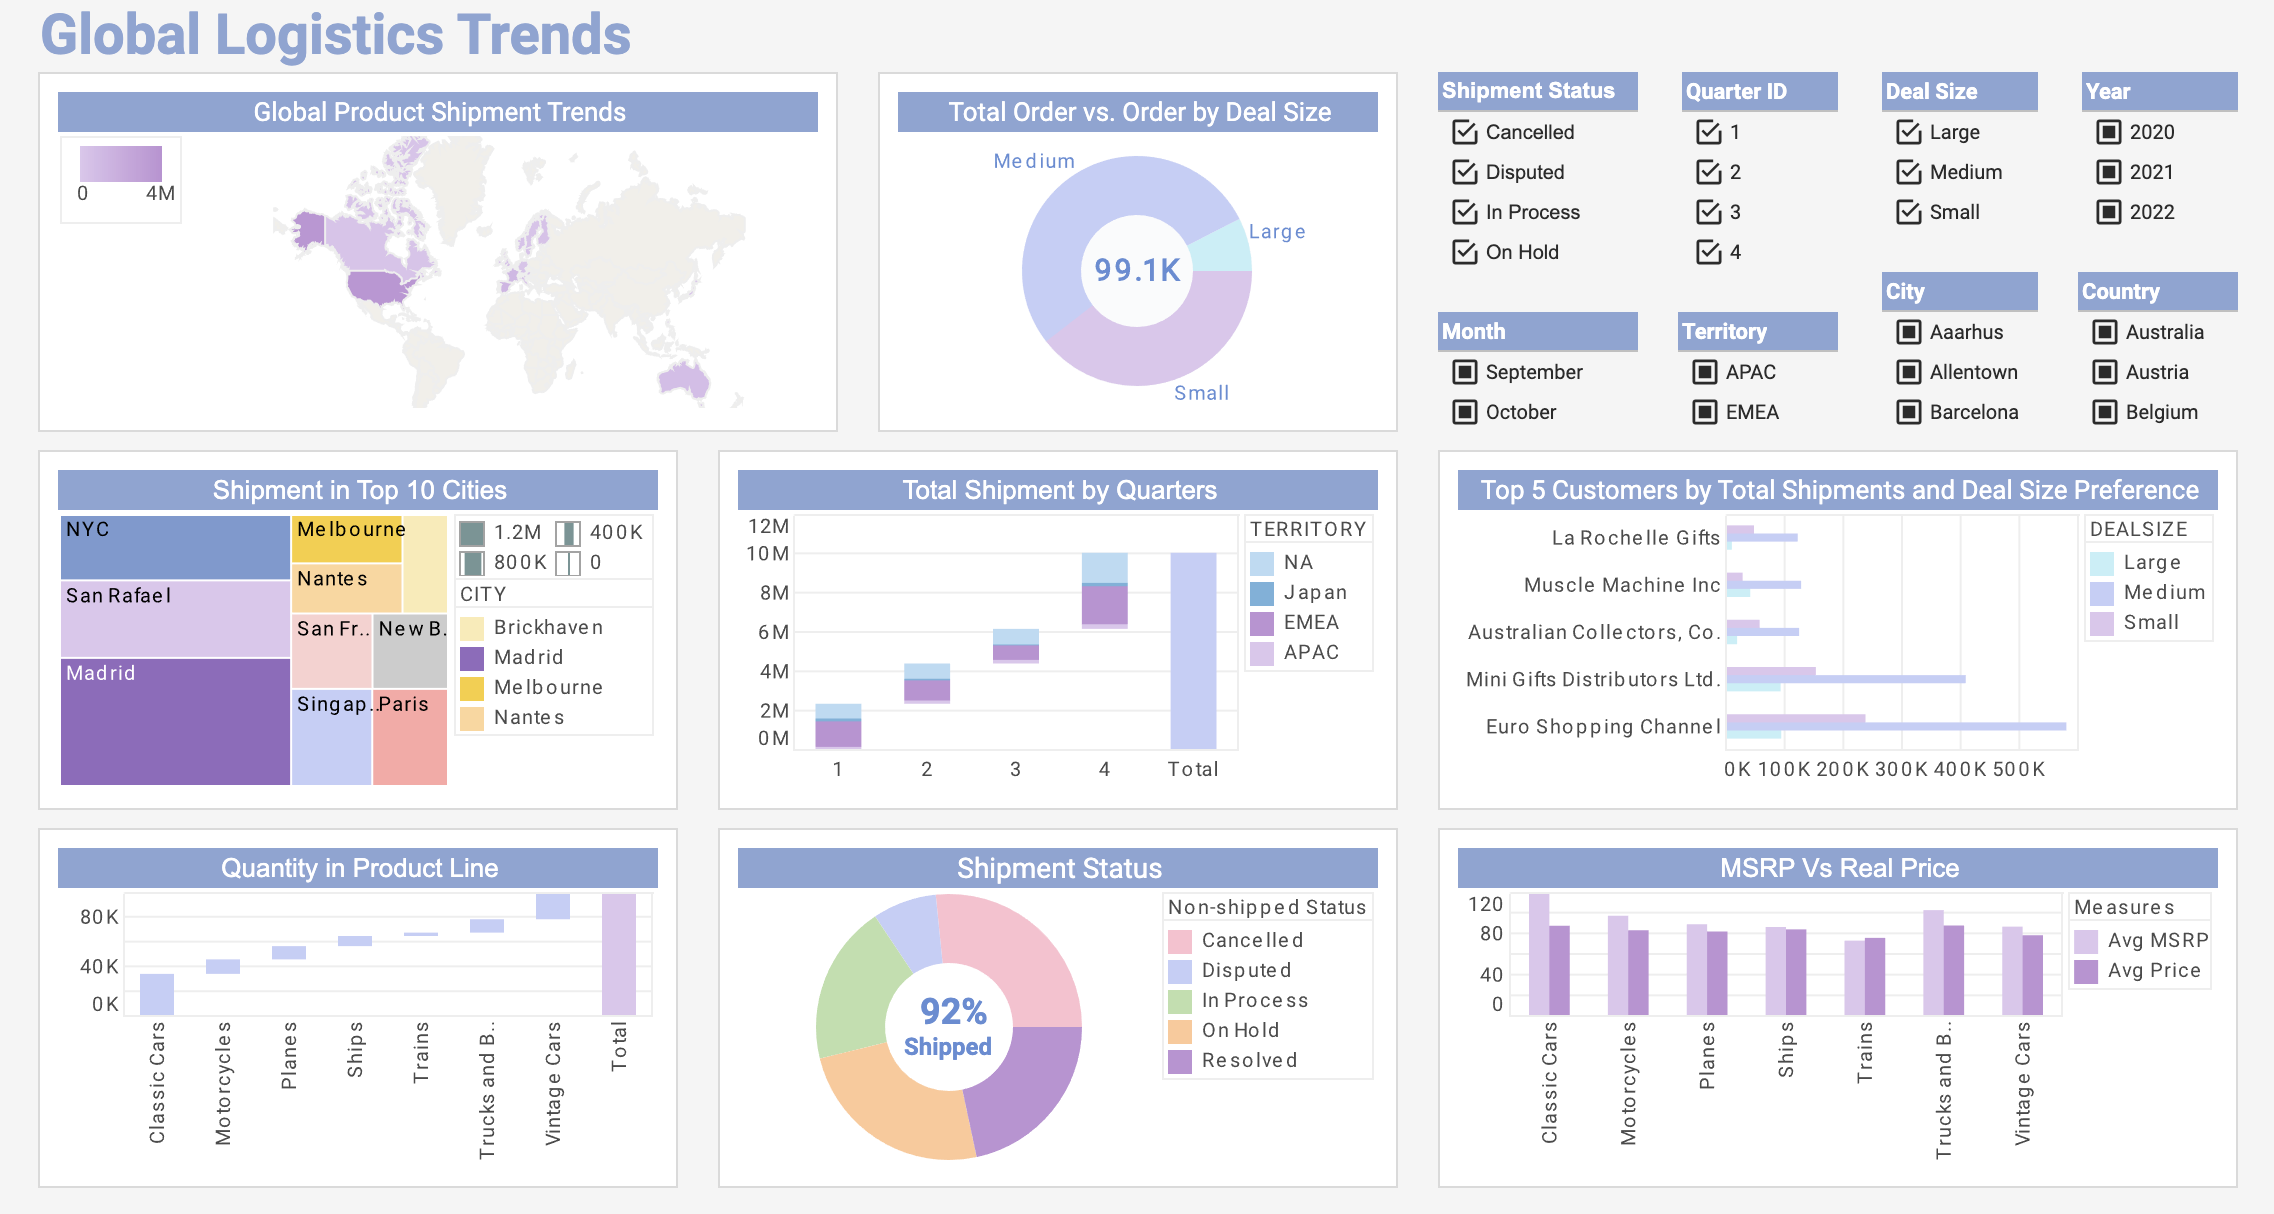
This visual exploration of global shipments gives logistics managers a high level view of their operations. A colorful treemap chart displays the top ten cities with the most shipments.
SuperStore
Temp Agency
Fusebill Subscriptions
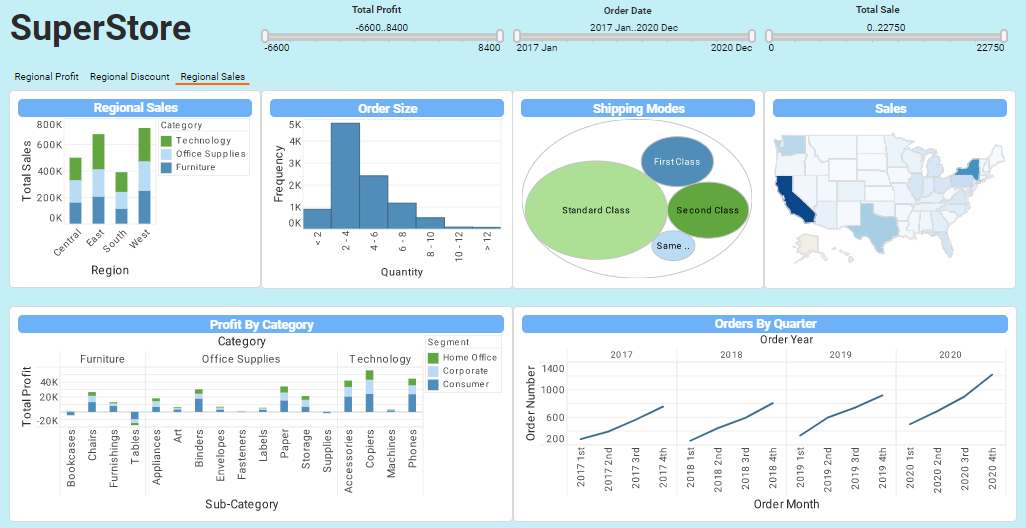
This dashboard for a major superstore chain helps regional managers identify strengths and weaknesses in the chain's brand strategy. A series of tabbed charts helps fit more information into limited dashboard space.
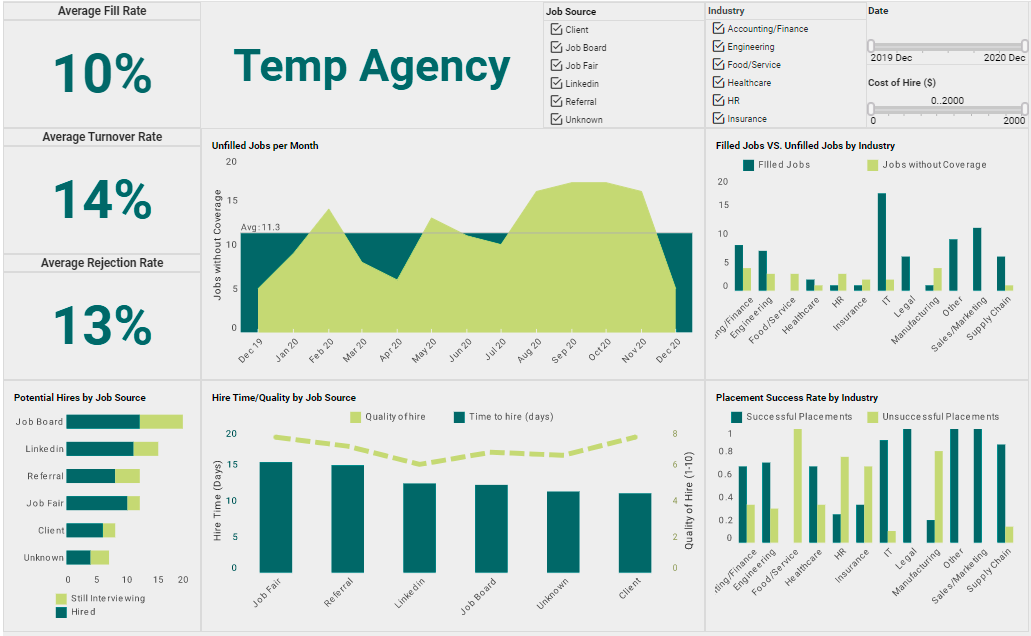
This temp agency dashboard helps recruiters track both successful and unsuccessful job placements by industry and job source. Quality of hire and time to hire are compared in one chart, helping managers to balance priorities.
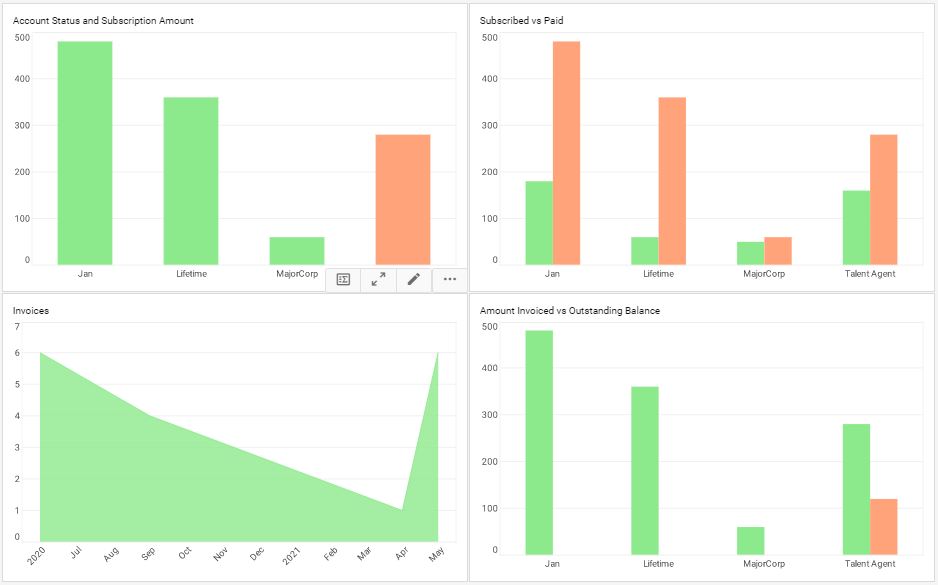
This dashboard pulls data directly from the Fusebill subscriptions platform, giving a breakdown of invoices and outstanding balances. Fusebill is just one of the many third party cloud data sources for which InetSoft's solution offers a custom data connector.
InetSoft's Management Dashboard Software
Are you looking for software tools to build performance dashboards? InetSoft offers free and commercial Web-based dashboard software that includes a drag and drop designer for creating impactful, interactive dashboards for enterprises and ISV's:
- For a free, no software to download option, try the InetSoft.com free app via the orange Start Free button an the top of this page.
- For our full-featured commercial application which includes advanced data mashup and security options, evaluate StyleBI.
