How Do You Set KPI Alert Thresholds?
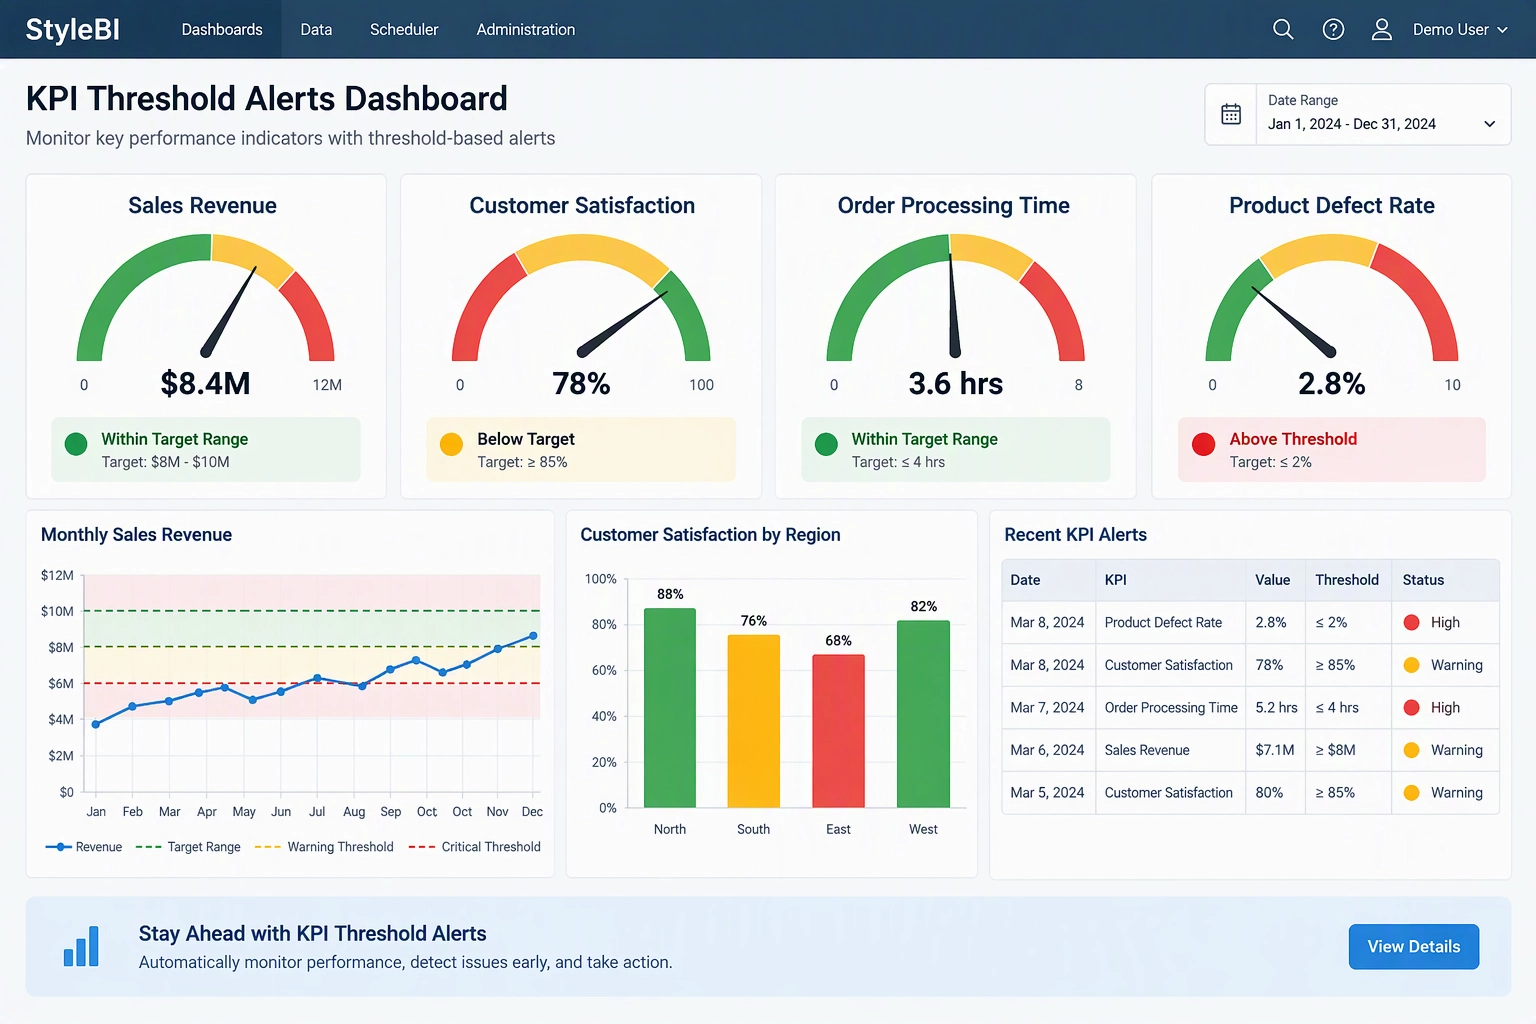
KPI alert thresholds help organizations detect performance issues before they become serious problems. When a metric crosses a predefined boundary, automated alerts notify decision-makers so they can investigate and take corrective action. The challenge is setting thresholds that are neither too sensitive nor too lenient. If alerts occur too frequently, users begin ignoring them. If they occur too late, opportunities and risks may go unnoticed.

What Are KPI Alert Thresholds?
A KPI alert threshold is a predefined value, percentage, range, or condition associated with a key performance indicator. When actual performance reaches or exceeds the threshold, an alert is triggered.
Examples include:
- Inventory falls below 500 units.
- Customer satisfaction drops below 85%.
- Website conversion rate declines by more than 10% week-over-week.
- Daily sales fall 15% below forecast.
- Average support response time exceeds four hours.
Rather than requiring managers to constantly monitor dashboards, alert thresholds automatically surface exceptions that require attention.
Why KPI Thresholds Matter
Well-designed KPI alerts provide several advantages:
- Faster identification of operational issues.
- Reduced business risk.
- Improved decision-making speed.
- Less manual report monitoring.
- Greater accountability across teams.
- Better alignment with organizational goals.
Organizations often have hundreds of metrics. Alert thresholds help leaders focus only on meaningful deviations from expected performance.
Types of KPI Alert Thresholds
Static Thresholds
Static thresholds use fixed values that rarely change. For example, inventory availability may need to remain above 1,000 units at all times.
Percentage-Based Thresholds
These thresholds trigger alerts when metrics change by a specified percentage. For example, an alert could be generated when monthly revenue declines more than 5%.
Range-Based Thresholds
Acceptable performance exists within a target range. A manufacturing defect rate may need to stay between 0.5% and 1.5%.
Trend Thresholds
Trend-based alerts focus on patterns rather than individual values. Three consecutive weeks of declining sales may trigger an investigation even if sales remain above target.
Dynamic Thresholds
Advanced analytics platforms can establish thresholds based on historical behavior, seasonal patterns, or predictive models. These alerts adapt as business conditions change.
How to Set KPI Alert Thresholds
1. Define Business Objectives
Start by understanding what the KPI is intended to measure and why it matters. Thresholds should reflect business priorities rather than arbitrary numbers.
2. Analyze Historical Data
Review historical performance to identify normal operating ranges. Understanding typical fluctuations helps distinguish real problems from routine variation.
3. Determine Risk Tolerance
Different metrics require different levels of sensitivity. For example, cybersecurity incidents may require immediate alerts, while minor website traffic fluctuations may not.
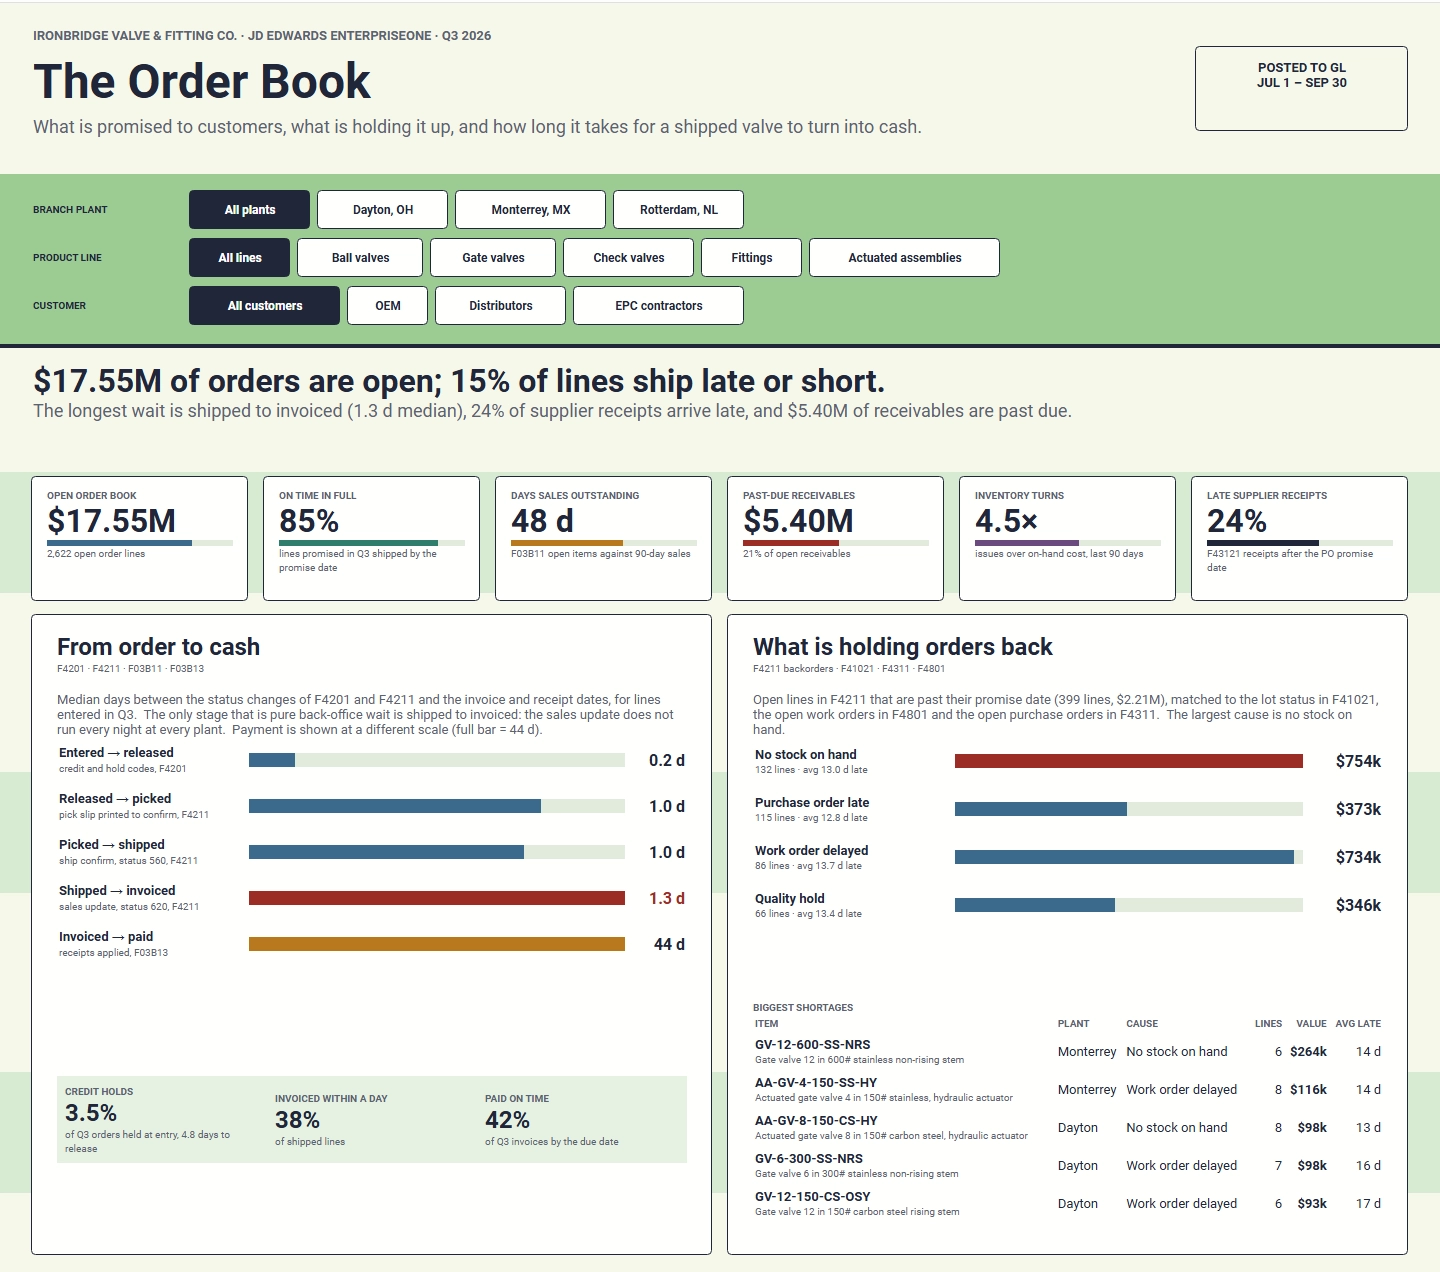
4. Create Warning and Critical Levels
Many organizations use multiple alert levels:
- Green: KPI is operating normally.
- Yellow: KPI is approaching a concerning level.
- Red: KPI requires immediate action.
This layered approach allows teams to respond before a problem reaches a critical stage.
5. Review and Adjust Periodically
Thresholds should evolve as business conditions change. Regular reviews ensure alerts remain meaningful and actionable.
Real-World Example
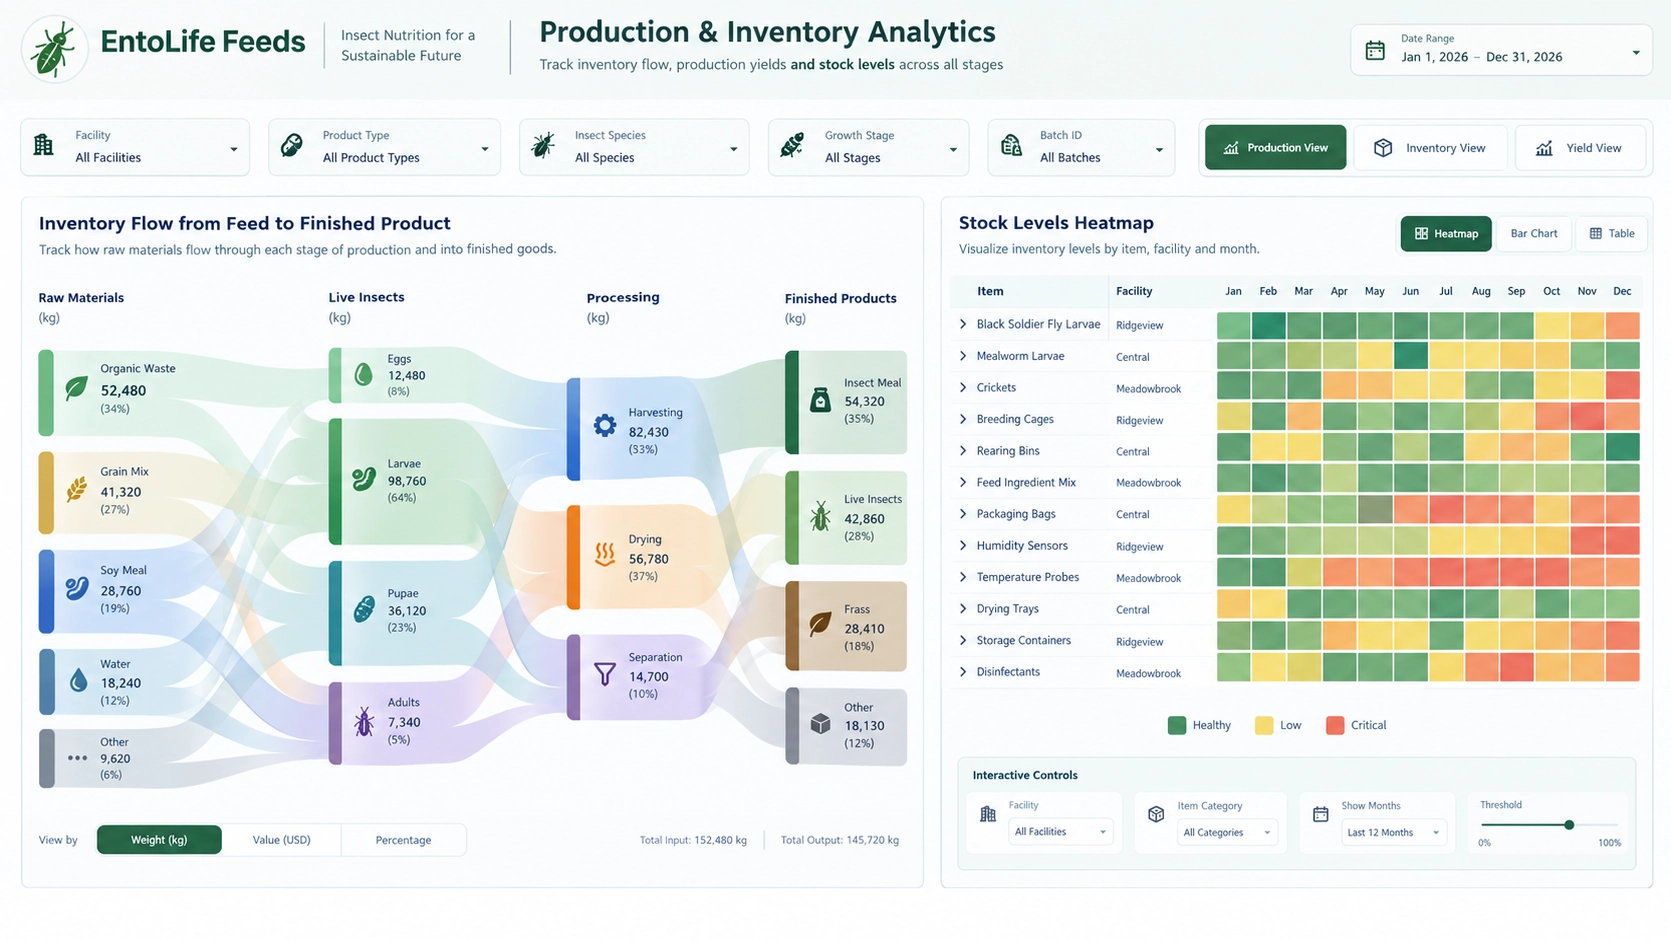
A retail company tracks inventory turnover across hundreds of products. Historically, a healthy turnover rate ranges between 6 and 10 times annually. Management establishes the following thresholds:
- Green: Above 6 turns.
- Yellow: Between 4 and 6 turns.
- Red: Below 4 turns.
When turnover drops below 4, store managers receive automated notifications. The alert directs them to investigate excess stock, pricing issues, supplier challenges, or declining product demand. As a result, inventory problems are identified weeks earlier than before.
Common KPI Threshold Mistakes
- Setting thresholds without historical analysis.
- Using the same threshold across all departments.
- Creating excessive alerts that cause fatigue.
- Ignoring seasonal fluctuations.
- Failing to revise thresholds as business conditions change.
- Monitoring too many metrics with equal urgency.
Effective alerts focus attention on the few exceptions that truly require action.
Automating KPI Alert Thresholds with Dashboards
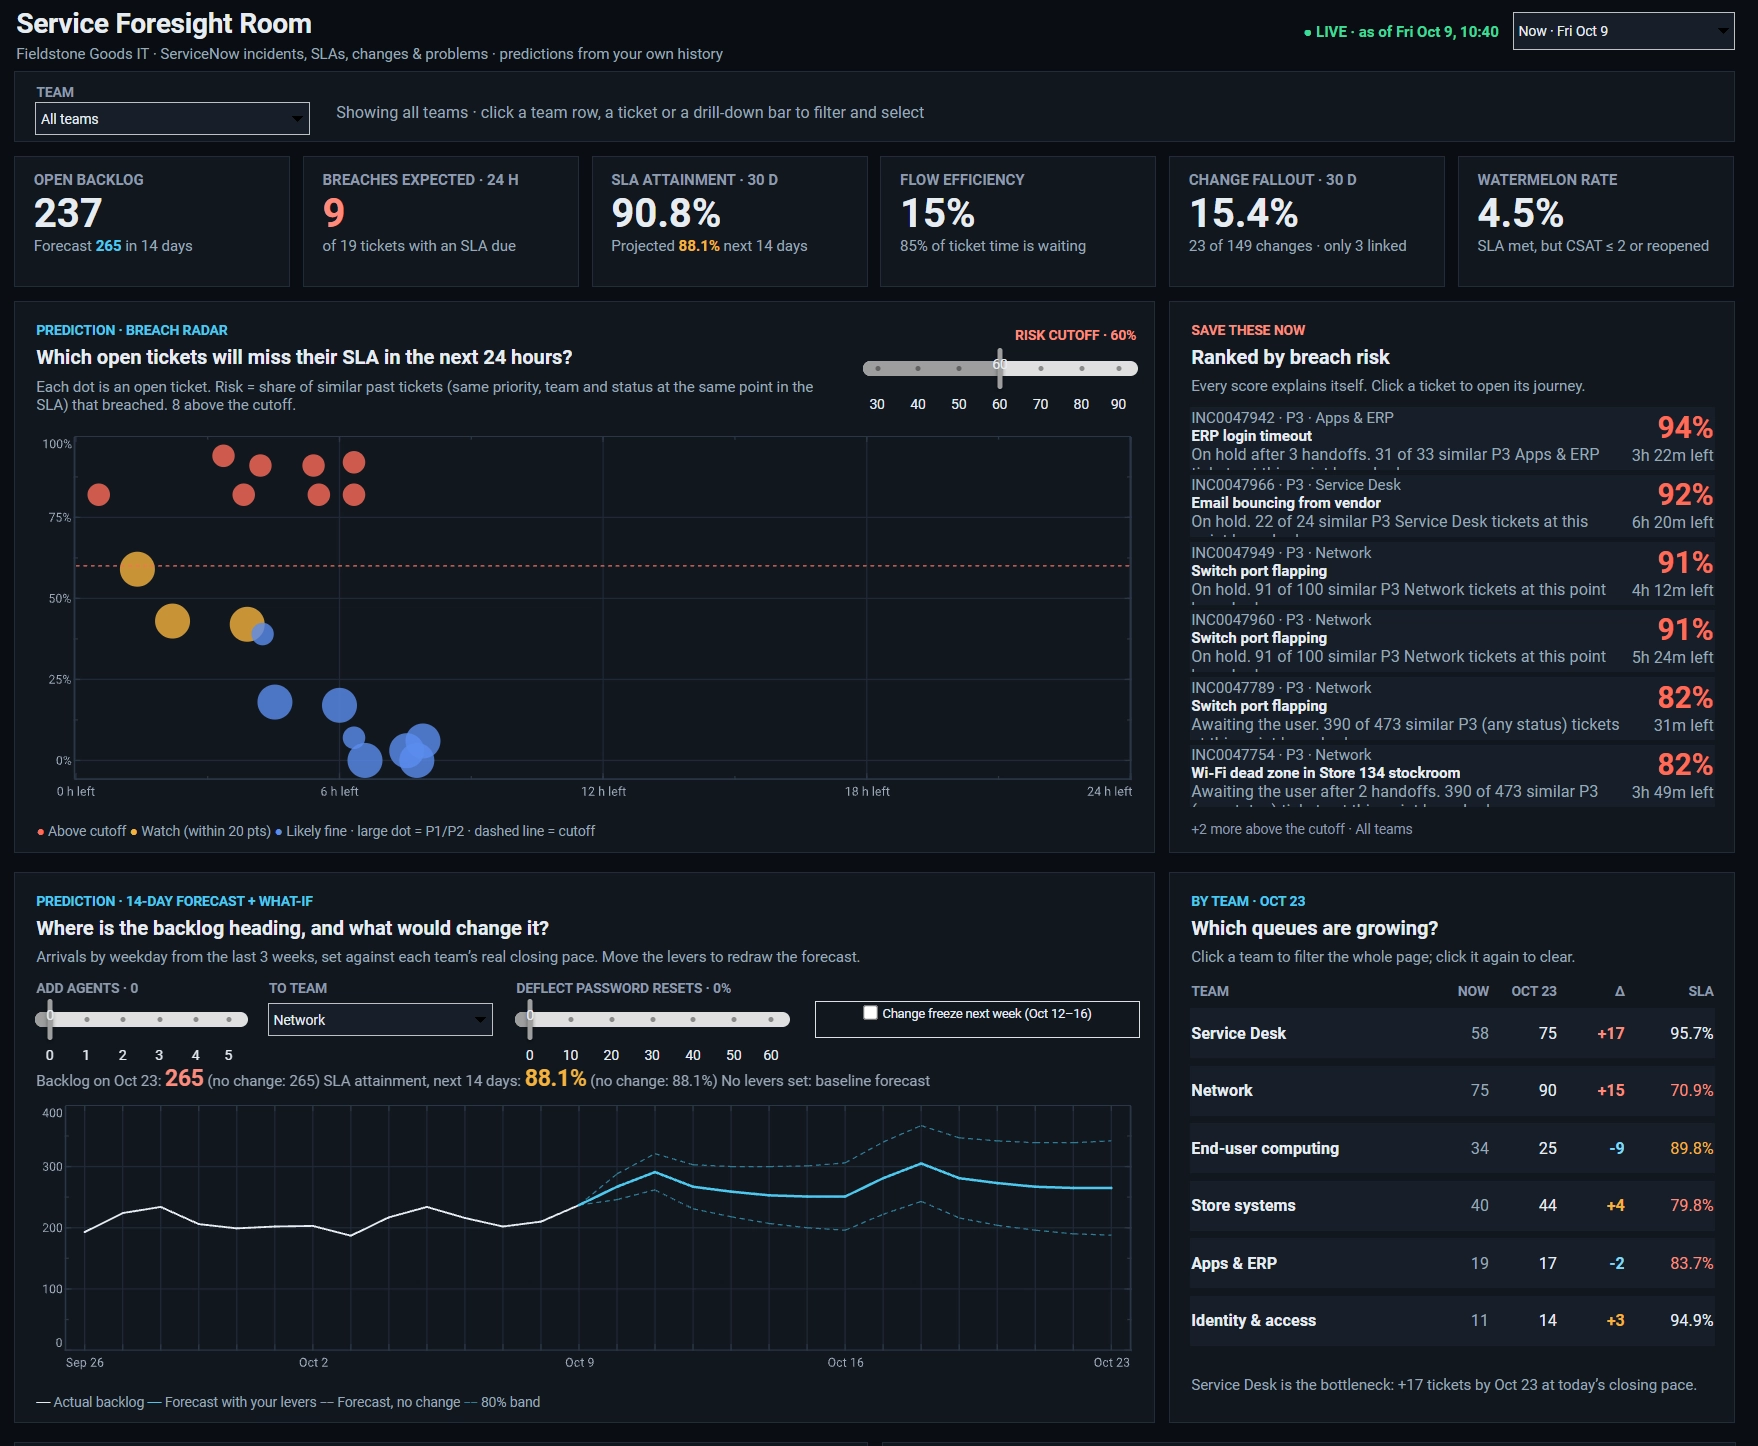
Modern business intelligence platforms can automate threshold monitoring across operational, financial, sales, HR, and customer service metrics. Users can configure alerts, schedule notifications, and visualize warning conditions directly within dashboards.
For example, an organization using StyleBI can configure KPI scorecards, conditional formatting, exception dashboards, and automated notifications that immediately highlight threshold violations. Managers gain visibility into emerging issues without constantly reviewing reports, enabling faster and more informed decisions.
Best Practices for KPI Alert Thresholds
- Align thresholds with strategic business objectives.
- Use historical data to establish realistic benchmarks.
- Create multiple severity levels.
- Monitor trends alongside point-in-time values.
- Reduce unnecessary alerts to prevent fatigue.
- Review and update thresholds regularly.
- Automate notifications through dashboards and analytics platforms.
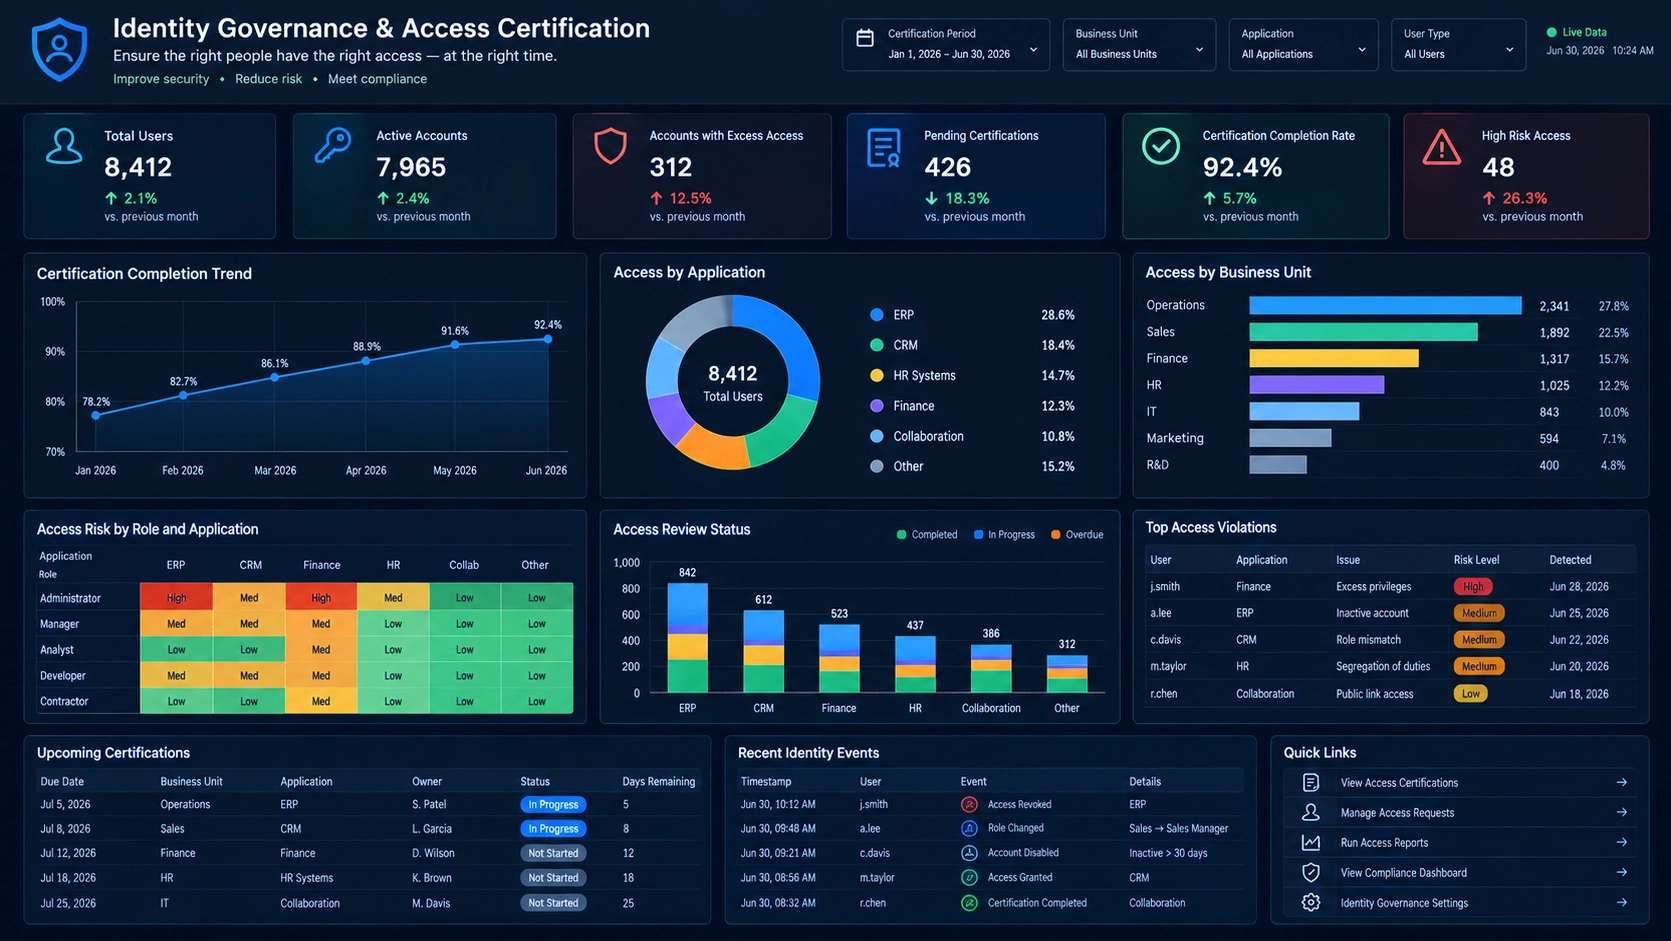
How to Set KPI Alert Thresholds in StyleBI
There are two common approaches for creating KPI alert thresholds in StyleBI:
- Option 1: Use a Gauge component with color-coded threshold ranges.
- Option 2: Use a Text component with conditions or custom scripting for alert notifications.
Option 1: Use a Gauge Component and Configure Threshold Ranges
- If necessary, create a new dashboard.
- From the Toolbox panel, drag a Gauge component onto the dashboard.
- Drag a measure from the data source onto the Gauge component.
- Right-click the Gauge component and select Properties.
- On the General tab, select the desired gauge face and appearance.
- Open the Data tab and choose the desired aggregation method from the Aggregate menu.
- Click OK to save the configuration.
- Resize the gauge as needed by dragging the component borders.
Configure Gauge Ranges for KPI Alerts
- Right-click the Gauge component and select Properties.
- Open the Advanced tab.
- In the Range section, enter a value for Range 1 and select a color. This defines the first KPI zone.
- Enter a value for Range 2 and choose a second color. This defines the next threshold zone.
- Continue adding ranges to represent additional KPI states such as Warning and Critical.
- Optionally select Gradient to smoothly blend colors between threshold zones.
- Click OK to apply the threshold settings.
Example:
- Green: KPI value from 80 to 100
- Yellow: KPI value from 60 to 79
- Red: KPI value below 60
This approach provides a visual KPI alert mechanism directly within the dashboard.
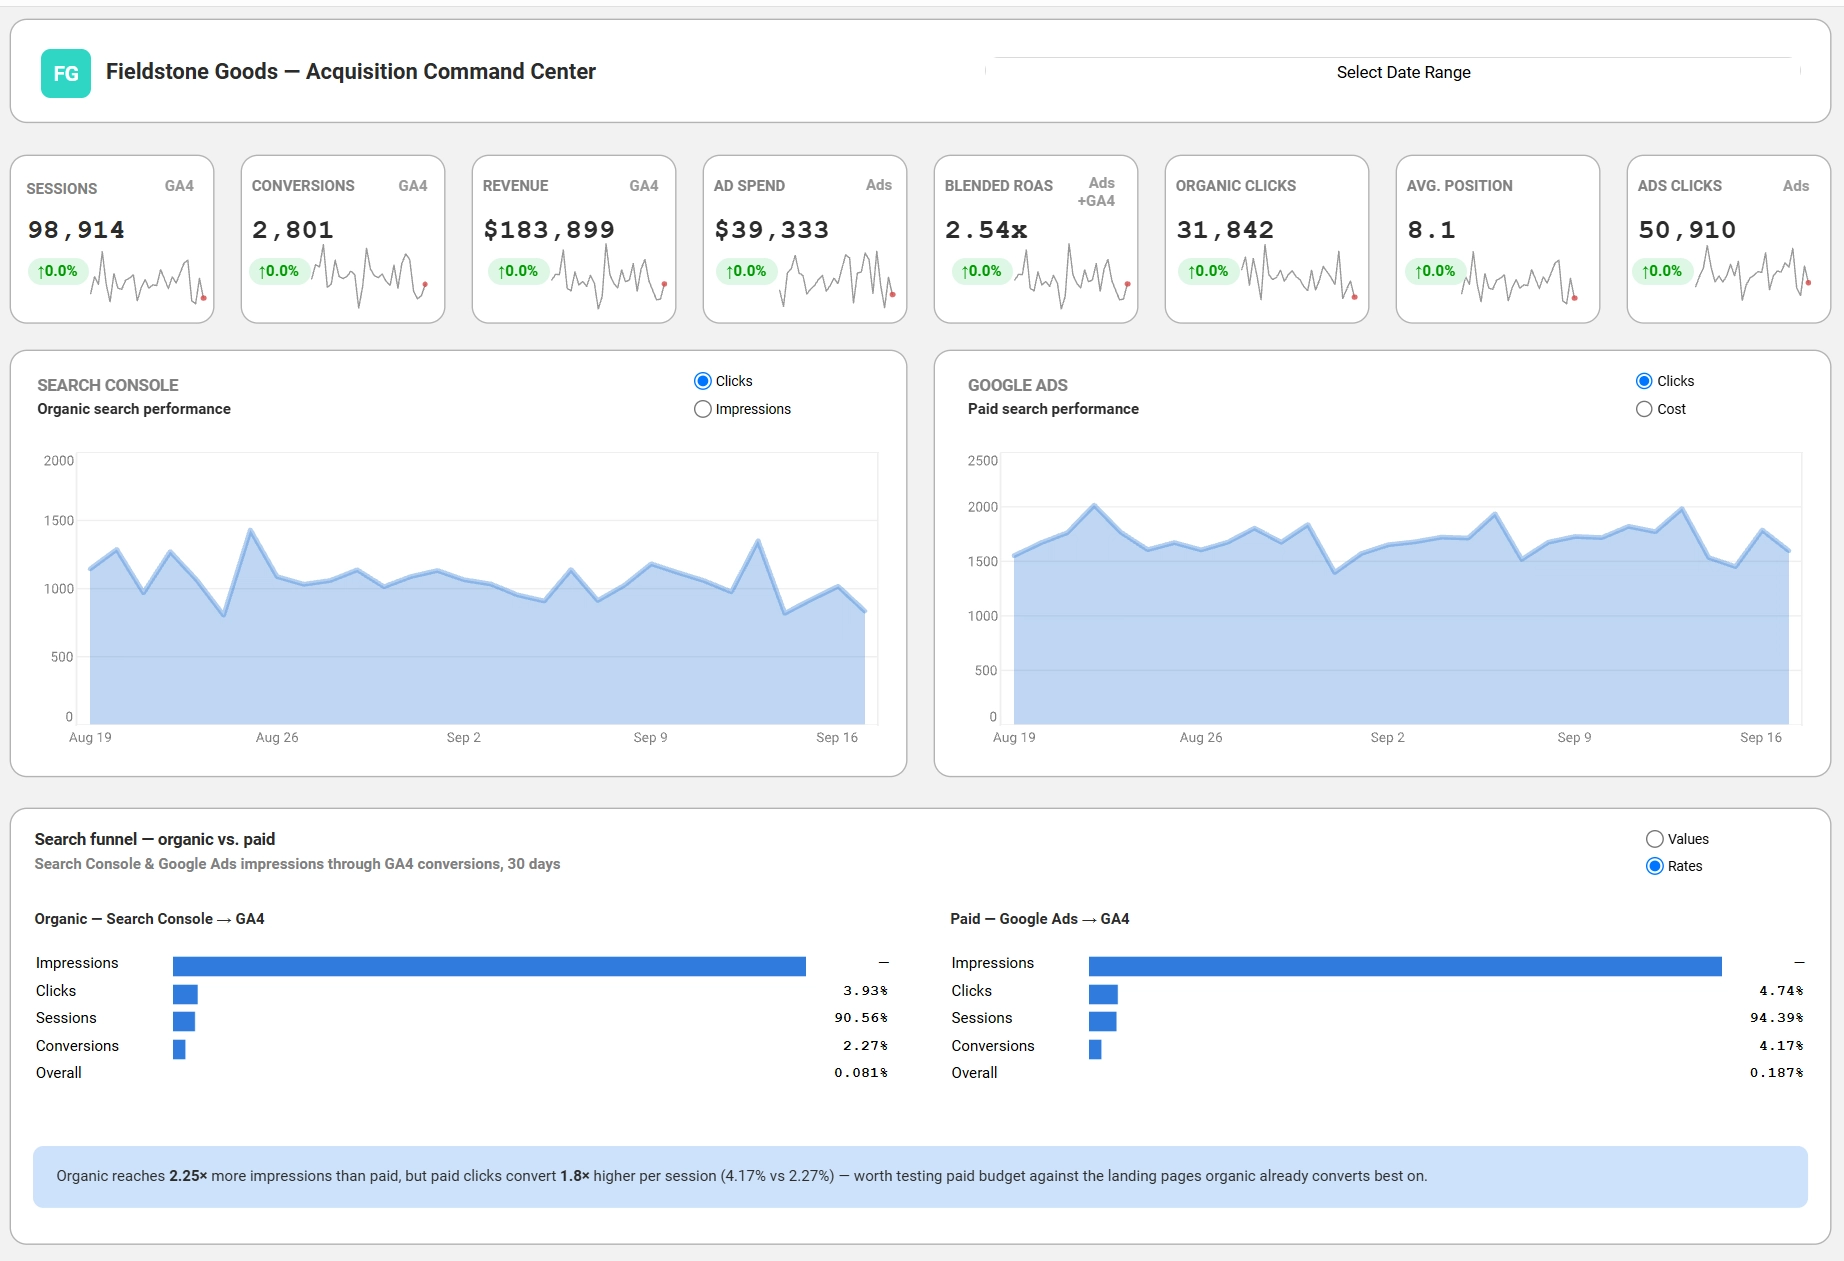
Option 2: Use a Text Component with Conditions or Script Logic
- If necessary, create a new dashboard.
- Drag a Text component from the Toolbox panel onto the dashboard.
- Drag a measure from the data source onto the Text component.
- Resize and format the Text component as desired.
- Right-click the Text component and select Properties.
- Open the Data tab and choose the appropriate aggregation method.
- Click OK.
- To create threshold-based filtering, right-click the Text component and select Condition.
- Define the appropriate conditions that represent KPI alert thresholds.
- Click OK to apply the condition.
For example, if a sales KPI falls below a target value, a condition can display an alert message or highlight the KPI using different formatting.
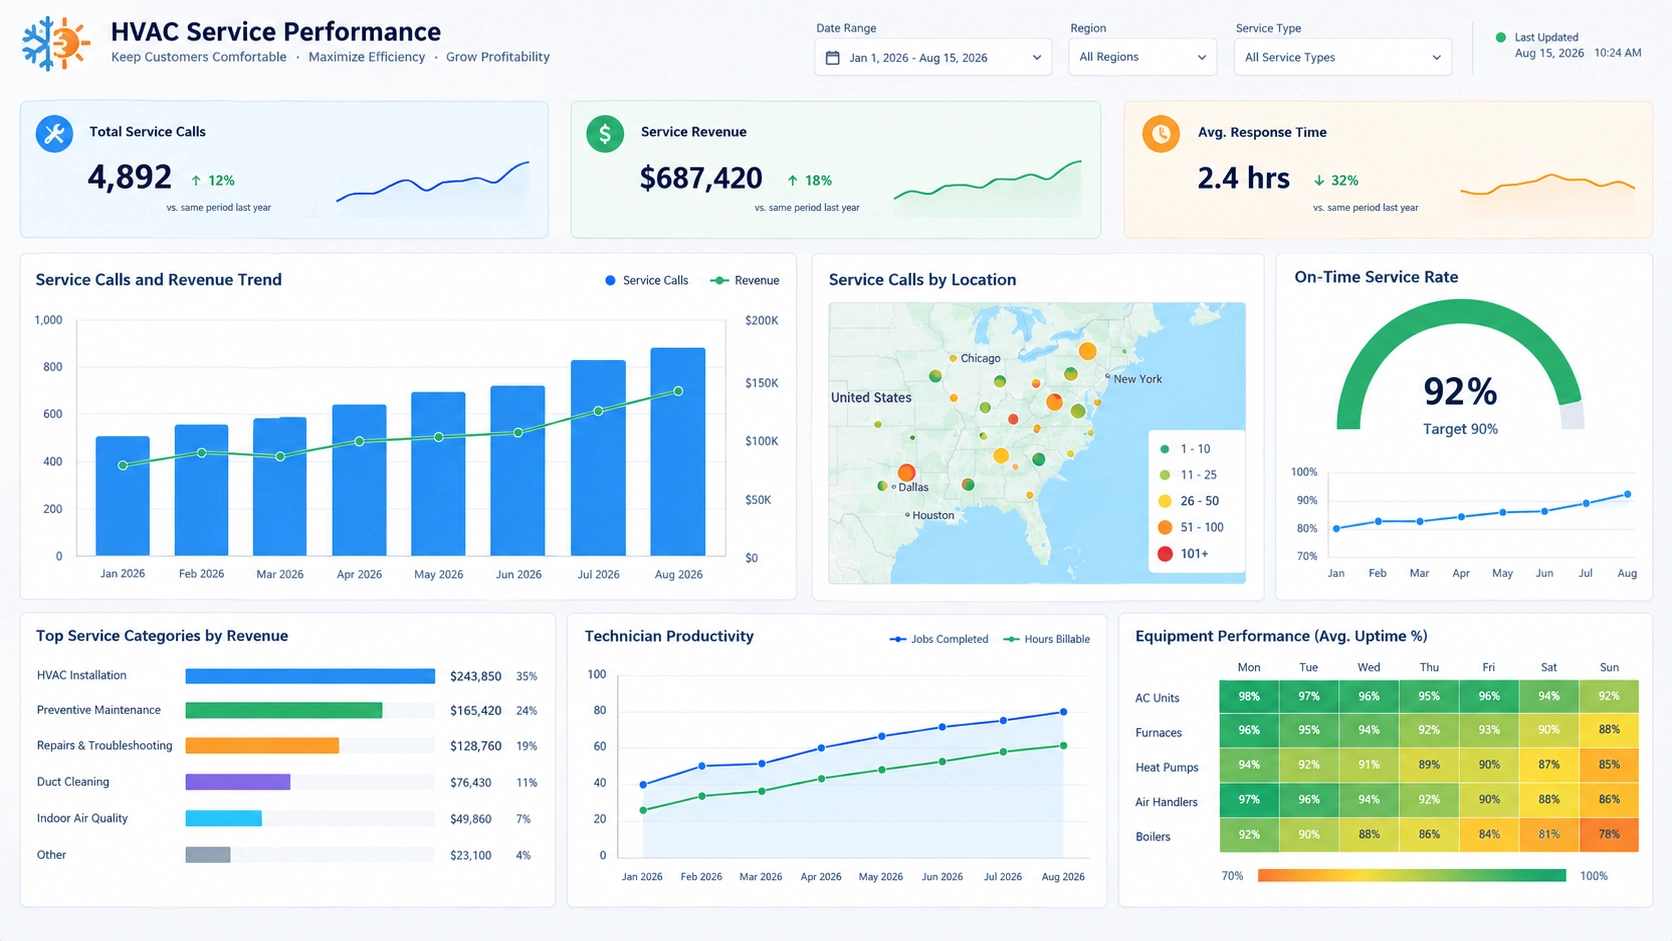
Using Script for Advanced KPI Alert Logic
When threshold logic becomes more complex than simple ranges or conditions, StyleBI allows KPI calculations and alert evaluations through scripting.
Custom logic can be implemented using:
- Calculated fields
- Text expressions on the General tab
- Script tab expressions that assign values to the KPI output
Scripting is typically used when alert thresholds depend on multiple metrics, dynamic benchmarks, trend analysis, or custom business rules.
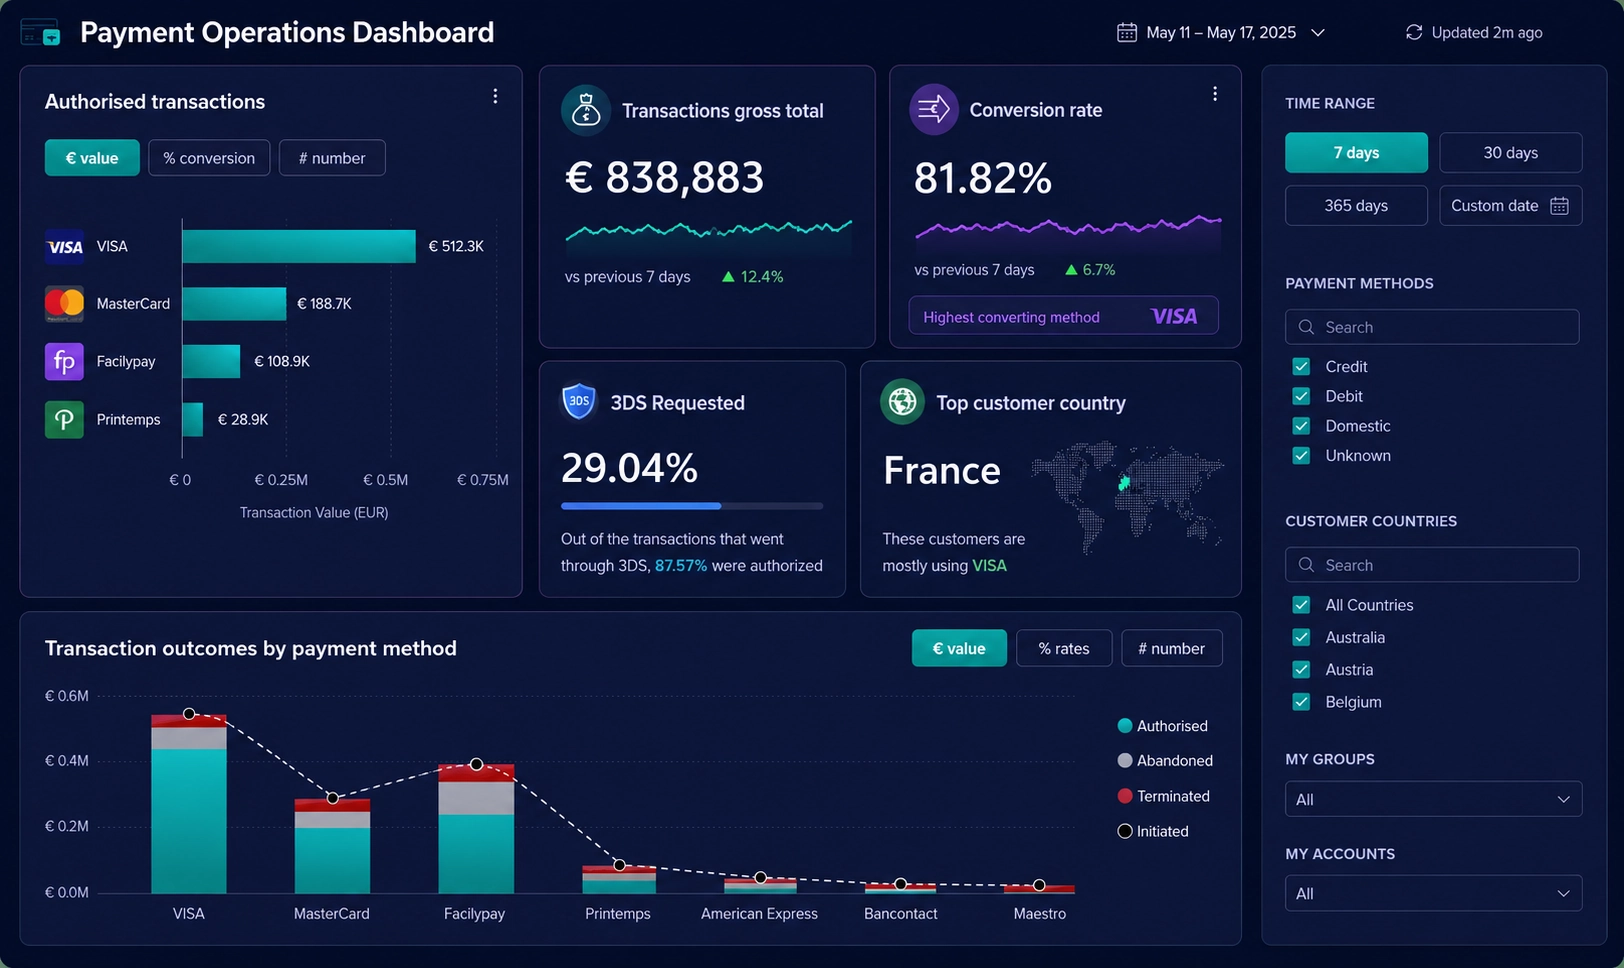
Recommended KPI Threshold Strategy
For most KPI alert implementations, Gauge ranges provide the simplest and most effective solution. The visual color zones make it easy for users to identify normal, warning, and critical performance levels at a glance.
Text components and scripting should be used when notifications require more sophisticated alert logic or custom messaging.
Maintain Stronger Operational Control
Setting KPI alert thresholds is a critical part of effective performance management. The best thresholds identify meaningful deviations while minimizing noise. By combining historical analysis, business context, risk awareness, and automated dashboard monitoring, organizations can respond faster to issues and maintain stronger operational control.