Learning about Key Performance Indicators In Marketing?
Key Performance Indicators (KPIs) are business metrics that are used to track an organization's performance. InetSoft is a business intelligence software provider who makes dashboard and reporting software that is most often used to track business performance, comparing actuals to forecast or target.
In general no software application is going to provide KPI's ready-to-use, since KPI's are metrics that are often derived from formulae that are specific to an enterprise in many cases, and in all cases the data that make up the KPI need to be mapped into the software application. However, InetSoft's application, StyleBI, is designed to be as easy as possible to deploy and use.

Examples of KPI's
To visualize how some common KPI's can be charted and analyzed in InetSoft's application look at the example screenshot below. This KPI example come from InetSoft's dashboard and reporting solution for salesforce.com, and can easily be built with InetSoft's on-premise business intelligence software application, StyleBI.
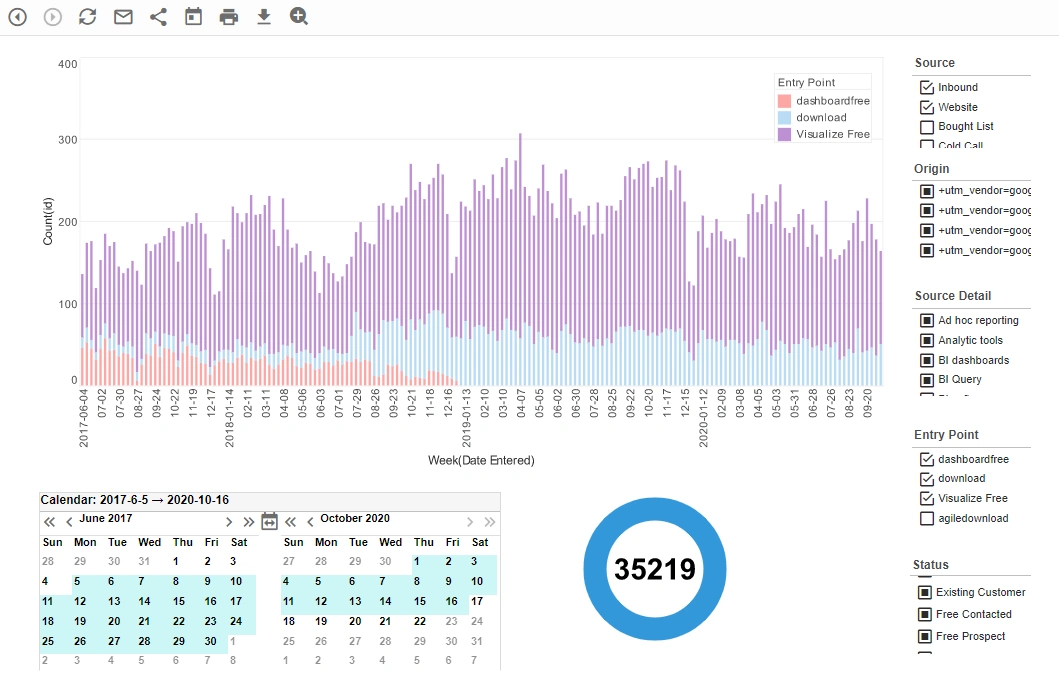
The Marketing Department of any products or services company needs to track leads as one of its KPIs. This screenshot shows the weekly count of the number of new leads generated. In addition, thanks to multi-dimensional charting of the source of leads by colors in the vertical bars, the reasons for a KPI's increase or decrease can be seen. The checkboxes to the right provide simple point-and-click access to filtering to explore further the reasons for change, or for slicing and dicing different campaigns, so that multiple KPIs can be tracked in a single "report."
Other marketing KPIs that could be tracked are churn, conversion rates, customer value, customer profitability, CPL, CPA, and CPGA.
More Articles About Marketing
-
Marketing Dashboard Software
This article explains how marketing teams can use InetSoft's StyleBI to build dashboards for monitoring campaign performance, lead generation, and ROI. It showcases visual analytics that help marketers track key metrics like cost per lead, conversion rates, and engagement across channels. The page also offers a live demo, illustrating how marketing dashboards enhance decision-making and strategy adjustments in real-time.
-
Marketing KPIs on Dashboards
This article covers the most important marketing KPIs, including customer acquisition cost, marketing qualified leads (MQLs), and return on marketing investment (ROMI). It demonstrates how these KPIs can be visualized using InetSoft dashboards to improve campaign effectiveness and align marketing initiatives with business objectives. The piece emphasizes using real-time dashboards to enable faster, data-driven marketing adjustments.
-
Digital Marketing KPIs and Analytics
This article explores how digital marketing teams can leverage InetSoft dashboards to track metrics such as website traffic, click-through rates, and social media engagement. It highlights how visual analytics can simplify identifying top-performing campaigns and content while optimizing budget allocation across channels. The article also demonstrates how to integrate data from web analytics and CRM systems into a unified dashboard for comprehensive digital marketing insights.
-
Social Media Dashboard KPIs
This page details how InetSoft dashboards can track key social media KPIs such as follower growth, engagement rates, and sentiment analysis. It illustrates how marketing teams can monitor multiple platforms from a single dashboard to assess campaign effectiveness and audience engagement. The article includes visuals showing how these dashboards help refine content strategies and improve brand visibility.
-
Lead Generation KPIs
This article discusses how marketers can use InetSoft dashboards to track lead generation KPIs like cost per lead, lead quality scores, and conversion rates. It explains how monitoring these KPIs helps optimize marketing funnels and align sales and marketing strategies for improved ROI. The article also showcases how to visualize lead data to quickly identify bottlenecks and high-performing campaigns.
-
Email Marketing KPIs
This article focuses on tracking key email marketing metrics using InetSoft dashboards, including open rates, click-through rates, and unsubscribe rates. It emphasizes how these metrics help marketers refine subject lines, content, and audience segmentation to improve campaign effectiveness. The page also demonstrates visual dashboards that simplify the monitoring of email performance across different campaigns and timeframes.
-
Content Marketing KPIs
This page explains how content marketers can use InetSoft dashboards to measure performance metrics like page views, average time on page, and content conversion rates. It describes how visualizing these KPIs enables marketers to identify top-performing content and optimize their content strategies. The article includes examples of dashboard charts that help demonstrate ROI on content initiatives.
