M&A Dashboards: KPIs and Advanced Analytics
Merger and acquisition activity is inherently complex, high stakes, and time sensitive. A well designed M&A dashboard does far more than summarize numbers. It becomes a strategic command center that helps partners, deal teams, analysts, and operating executives understand pipeline health, risk exposure, valuation trends, and post-close performance in real time.
When built correctly, it transforms fragmented deal data into actionable intelligence. An effective M&A dashboard reflects the full lifecycle of a transaction: origination, qualification, diligence, negotiation, closing, and post-merger integration.
Each stage generates its own set of key performance indicators, and each KPI serves a different strategic purpose. Together, they provide visibility into growth velocity, execution quality, and value creation.

Pipeline and Origination KPIs
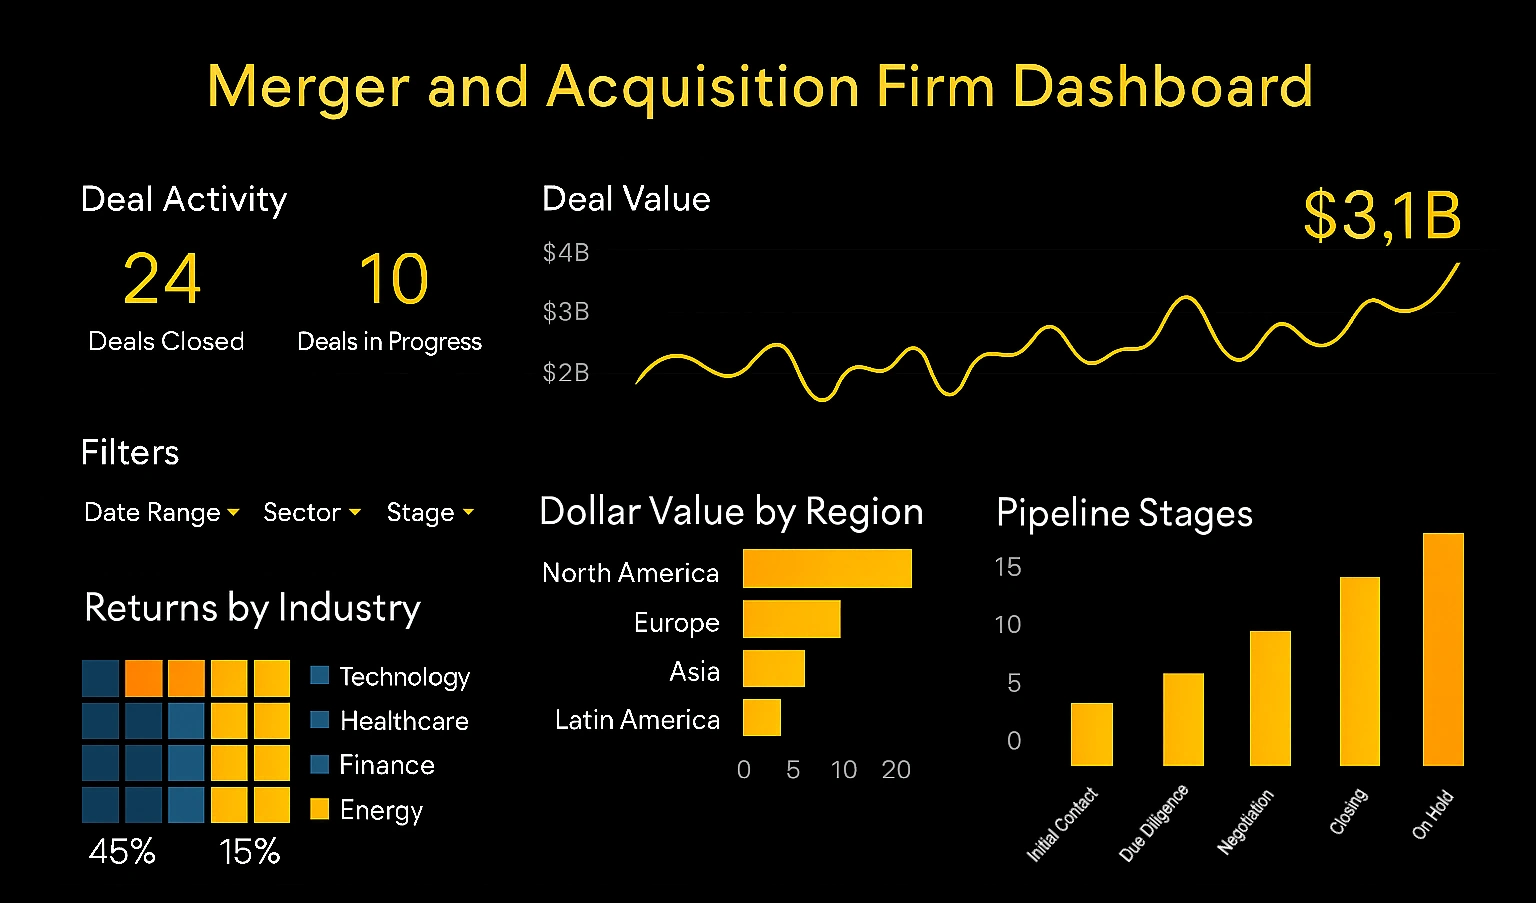
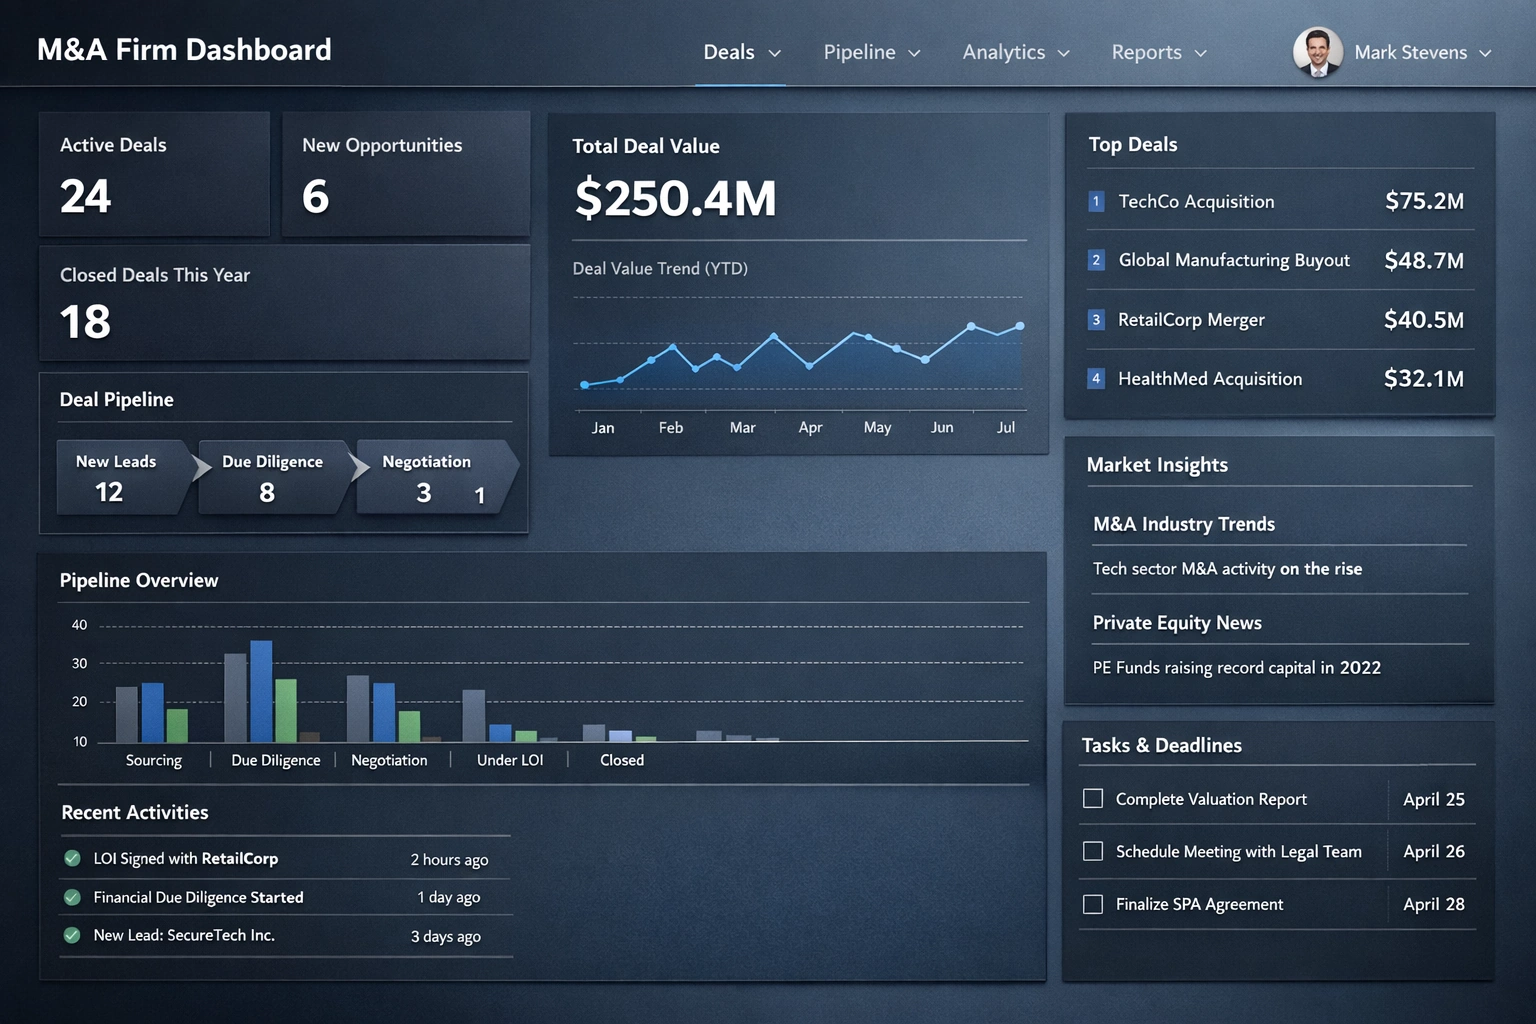
Total Deal Pipeline Value
Total pipeline value represents the aggregate projected transaction value across all active opportunities. This metric is often segmented by stage, geography, sector, or deal type. It helps leadership evaluate whether future capital deployment and growth objectives are supported by sufficient deal flow.
Number of Active Deals
The total count of active transactions provides a snapshot of workload and opportunity volume. When broken down by stage such as sourcing, NDA signed, indication of interest, letter of intent, due diligence, and definitive agreement, it reveals the overall health and balance of the pipeline.
New Opportunities Sourced
This KPI measures the number of new potential deals identified within a specific time frame. Tracking sourcing by channel, including banker referrals, proprietary outreach, inbound leads, and conferences, helps assess the effectiveness of business development strategies.
Stage Conversion Rates
Conversion rates between stages indicate how efficiently opportunities move forward. Examples include the percentage of reviewed opportunities that progress to LOI, or the percentage of LOIs that convert to signed agreements. These ratios reveal screening quality, valuation discipline, and negotiation strength.
Deal Cycle Time
Deal cycle time measures the average duration from first contact to closing. It highlights operational efficiency and coordination across teams. Excessive duration may increase costs and risk, while unusually short cycles may suggest insufficient diligence.
Win Rate
Win rate reflects the percentage of pursued deals that successfully close, particularly relevant in competitive auction environments. Comparing win rates across industries or advisor relationships can uncover strategic advantages or weaknesses.
Financial and Valuation KPIs
Total Deal Value Closed
This year to date metric reflects realized capital deployment. It demonstrates execution capacity and provides context for revenue generation and management fee calculations.
Average Deal Size
Average transaction size signals strategic positioning. Some firms focus on smaller, repeatable acquisitions, while others target fewer but transformative transactions.
Entry Multiples
Enterprise value to EBITDA multiples paid at acquisition measure pricing discipline. Monitoring average entry multiples across sectors ensures valuation assumptions remain aligned with market conditions.
Exit Multiples
For divested assets, exit multiples indicate realized market value. Comparing entry and exit multiples provides insight into value creation driven by operational improvement versus multiple expansion.
Internal Rate of Return and MOIC
Internal rate of return and multiple on invested capital measure the financial success of completed deals. These performance indicators can be displayed at both transaction and portfolio levels.
Net Present Value
NPV quantifies the difference between projected cash inflows and the initial investment, discounted at the cost of capital. Positive NPV signals value accretion.
Leverage and Financing Metrics
Debt to EBITDA ratios, weighted average cost of capital, interest coverage ratios, and covenant headroom track financial risk. For firms using leverage extensively, monitoring aggregate portfolio exposure is essential.
Due Diligence and Execution KPIs
Diligence Completion Rate
This metric tracks the percentage of requested documents and analyses completed during diligence. Delays in financial, legal, tax, or operational reviews may signal risk.
Red Flag Issues Identified
The number and severity of identified red flags during diligence influence pricing and deal viability. Dashboards often categorize these by legal, regulatory, operational, or financial risk.
Regulatory Approval Status
Tracking antitrust filings, cross border approvals, and compliance milestones ensures transaction timelines remain predictable.

Milestone Tracking
Key execution milestones such as LOI submission, exclusivity period, financing commitment, and signing dates help teams monitor progress against planned schedules.
Post Merger Integration KPIs
Synergy Realization Percentage
Expected cost and revenue synergies are typically defined during deal modeling. Post close dashboards track actual synergy capture as a percentage of projected targets.
Integration Milestone Completion
This KPI measures progress against integration roadmaps, including systems consolidation, procurement alignment, and organizational restructuring.
Revenue Growth and Margin Expansion
Post acquisition revenue acceleration and margin improvement indicate operational enhancement and strategic fit.
Working Capital Efficiency
Improvements in inventory turnover, accounts receivable days, and cash conversion cycles demonstrate operational optimization.
Leadership Retention and Talent Metrics
Executive retention rates and employee turnover provide insight into cultural integration and long term sustainability.
Portfolio Level KPIs
Aggregate Revenue Growth
Portfolio wide revenue growth highlights the combined performance of acquired assets.
Sector and Geographic Concentration
Monitoring exposure by industry and region helps manage macroeconomic and geopolitical risk.
Customer Concentration Risk
High dependence on a small number of customers can increase vulnerability. Dashboards quantify this concentration at both company and portfolio levels.

Advanced Analytics in M&A Dashboards
Predictive Deal Closure Modeling
Machine learning models analyze historical transactions to estimate the probability of deal completion. Variables may include sector familiarity, deal size, competitive intensity, and timing.
Valuation Forecasting
Predictive analytics incorporating macroeconomic data, sector growth, and capital market conditions can estimate future EBITDA multiples and inform bidding strategy.
Scenario and Sensitivity Modeling
Interactive financial models allow users to stress test assumptions. Adjusting revenue growth, margin projections, or financing terms instantly recalculates projected IRR and NPV.
Natural Language Processing for Target Identification
AI tools can scan news, filings, and earnings transcripts to identify potential acquisition targets and detect early indicators of strategic shifts or financial distress.
Portfolio Optimization Algorithms
Optimization models allocate capital across competing acquisition opportunities to maximize expected return within defined risk parameters.
Process Mining and Operational Analytics
Post integration process data can be analyzed to identify inefficiencies and quantify performance improvement resulting from acquisition.
Time Series Analysis
Revenue and margin trends can be evaluated for structural changes following acquisition, distinguishing organic growth from transaction driven impact.
Benchmarking and Relative Performance
External market data enables comparison against industry peers. Relative outperformance indicates true value creation rather than favorable macro conditions.
Risk Scoring Models
Probability weighted risk scores can be assigned to regulatory delays, customer attrition, or integration challenges, providing early warning signals.
The Strategic Role of M&A Dashboards
An effective M&A dashboard is not merely a reporting tool. It is a decision platform that centralizes financial, operational, and strategic data into a coherent analytical framework. By highlighting deviations from plan, surfacing risk early, and aligning stakeholders around measurable objectives, it improves execution discipline.
As transaction environments grow more competitive and data intensive, dashboards increasingly integrate real time feeds, automated data ingestion, and advanced analytics. Firms that leverage these capabilities gain clarity, speed, and precision in capital allocation decisions. In a field where timing and valuation discipline determine success, analytical visibility becomes a competitive advantage.

Recommended External Resources for Further Reading on M&A Dashboards, KPIs, and Advanced Analytics
Here are four high-quality, relevant external resources that expand on the themes in this article. These include practical guides, case studies, and insights from industry experts on M&A metrics, dashboard implementation, and analytics applications.
1. From Static to Strategic: Understanding The M&A KPI Lifecycle
https://www.midaxo.com/blog/from-static-to-strategic-understanding-the-ma-kpi-lifecycle
This Midaxo blog post explores how M&A teams evolve KPIs across the deal lifecycle, from tracking pipeline health to post-merger value creation, with tips on adaptation and maximization—directly complementing the article's emphasis on origination, execution, and integration metrics.
2. M&A Metrics vs. Deal Flow Metrics: Key Differences
https://www.clearlyacquired.com/blog/m-a-metrics-vs-deal-flow-metrics-key-differences
Clearly Acquired's article differentiates M&A success metrics (e.g., revenue growth, integration) from deal flow indicators, advocating for integrated dashboards—aligning with the article's discussion of pipeline KPIs, financial metrics, and portfolio-level analytics for SMB acquisitions.

3. Integration Insights: Best Dashboards for M&A
https://www.mergerai.co/blog/m-a-integration-dashboard
This MergerAI guide details building effective M&A integration dashboards, including selecting KPIs for synergies and operations, with a focus on quality metrics—extending the article's coverage of post-merger KPIs and advanced analytics like scenario modeling.
4. How Data Analytics is Reshaping M&A and Due Diligence
https://scrubbed.net/blog/how-data-analytics-is-reshaping-ma-and-due-diligence
Scrubbed's post discusses AI and analytics in M&A due diligence, including data visualization dashboards for risk detection and KPI tracking—building on the article's advanced sections like predictive modeling, NLP for target identification, and benchmarking.