Open Source Reporting Tools: A Practical Guide for Modern Teams
Open source reporting tools have become a powerful alternative to proprietary BI platforms, offering flexibility, transparency, and cost efficiency for organizations that want full control over their analytics stack.
Whether you’re building dashboards, generating pixel-perfect reports, or embedding analytics into applications, open source tools provide a customizable foundation without vendor lock-in.
This guide explains what open source reporting tools are, how they compare to commercial BI platforms, which tools are most widely used, and how to choose the right solution for your team.
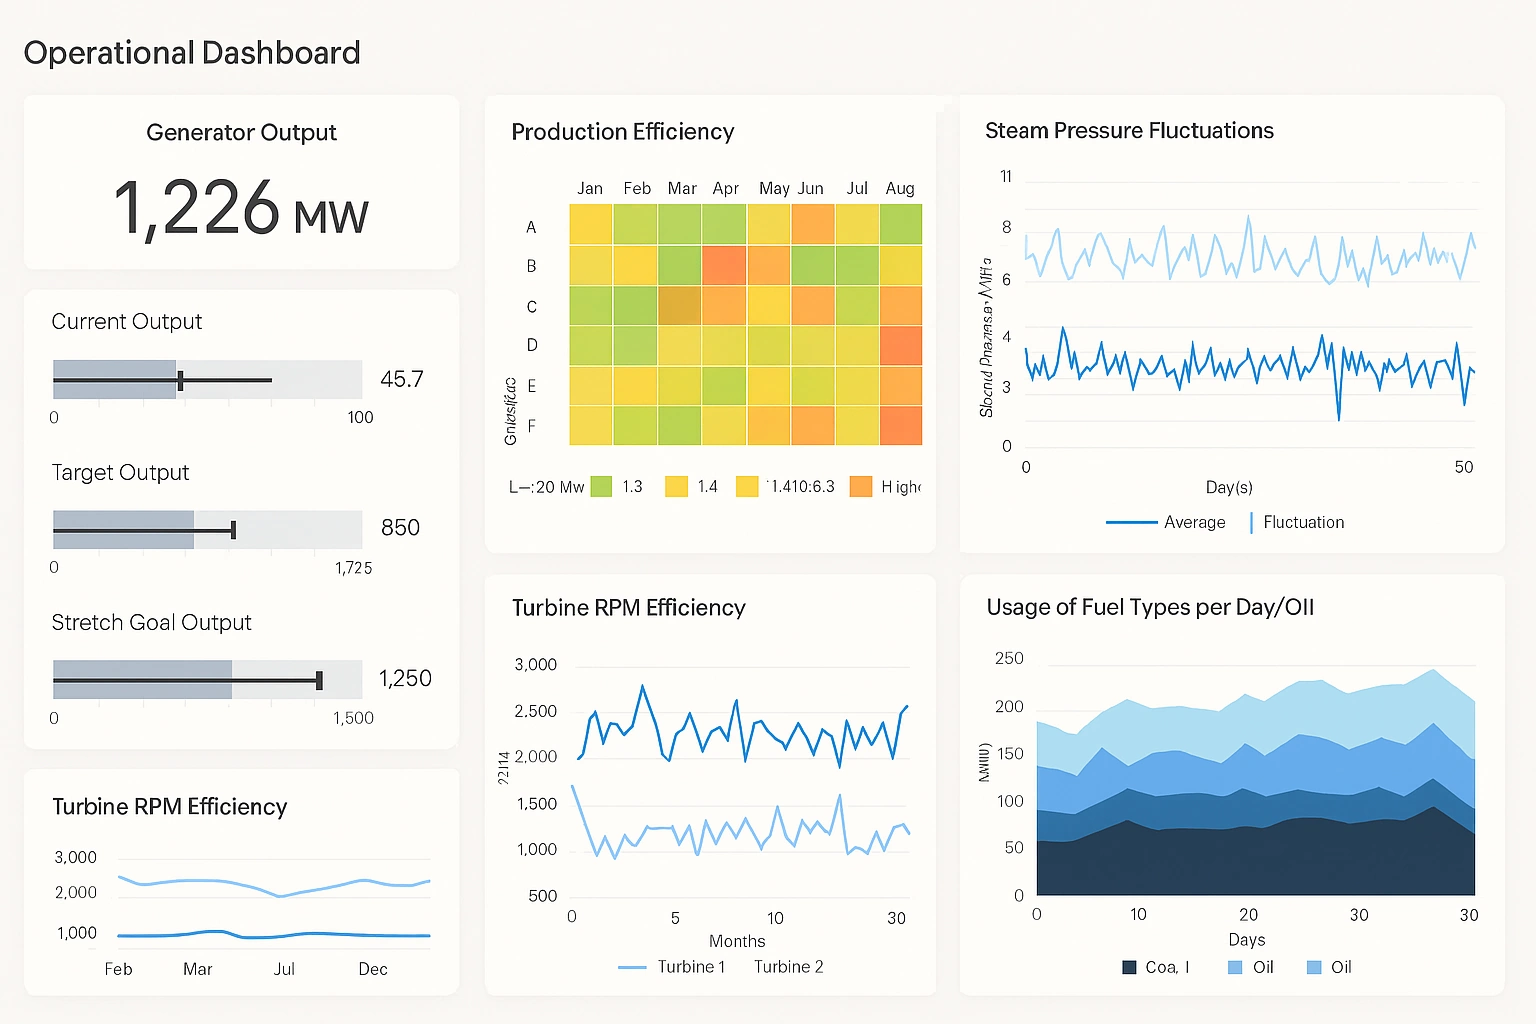

What Are Open Source Reporting Tools?
Open source reporting tools are software frameworks that allow teams to design, generate, and distribute reports using freely available source code. They typically support:
- Data connections to SQL databases, APIs, and cloud warehouses
- Report design using templates or drag-and-drop builders
- Export formats such as PDF, Excel, HTML, and CSV
- Dashboard creation and interactive visualizations
- Embedding analytics into internal or customer-facing applications
Because the source code is open, organizations can customize functionality, integrate deeply with existing systems, and avoid licensing fees.
Top Open Source Reporting Tools
This list aligns with common search intent for “open source reporting tools.”
1. Metabase
A user-friendly BI tool with dashboards, SQL editors, and automated insights. Ideal for teams that want simplicity and fast deployment.
2. StyleBI Open Source
A flexible reporting and dashboarding platform supporting mashups, pixel-perfect reports, and enterprise-grade data modeling.
3. JasperReports
A long-standing reporting engine used for PDF generation, embedded reporting, and Java-based applications.
4. BIRT
A mature Eclipse-based reporting framework popular in Java environments.
5. Grafana
Primarily a monitoring tool, but widely used for dashboards and time-series reporting.
6. Redash
A lightweight SQL-centric dashboarding tool for analysts and engineers.
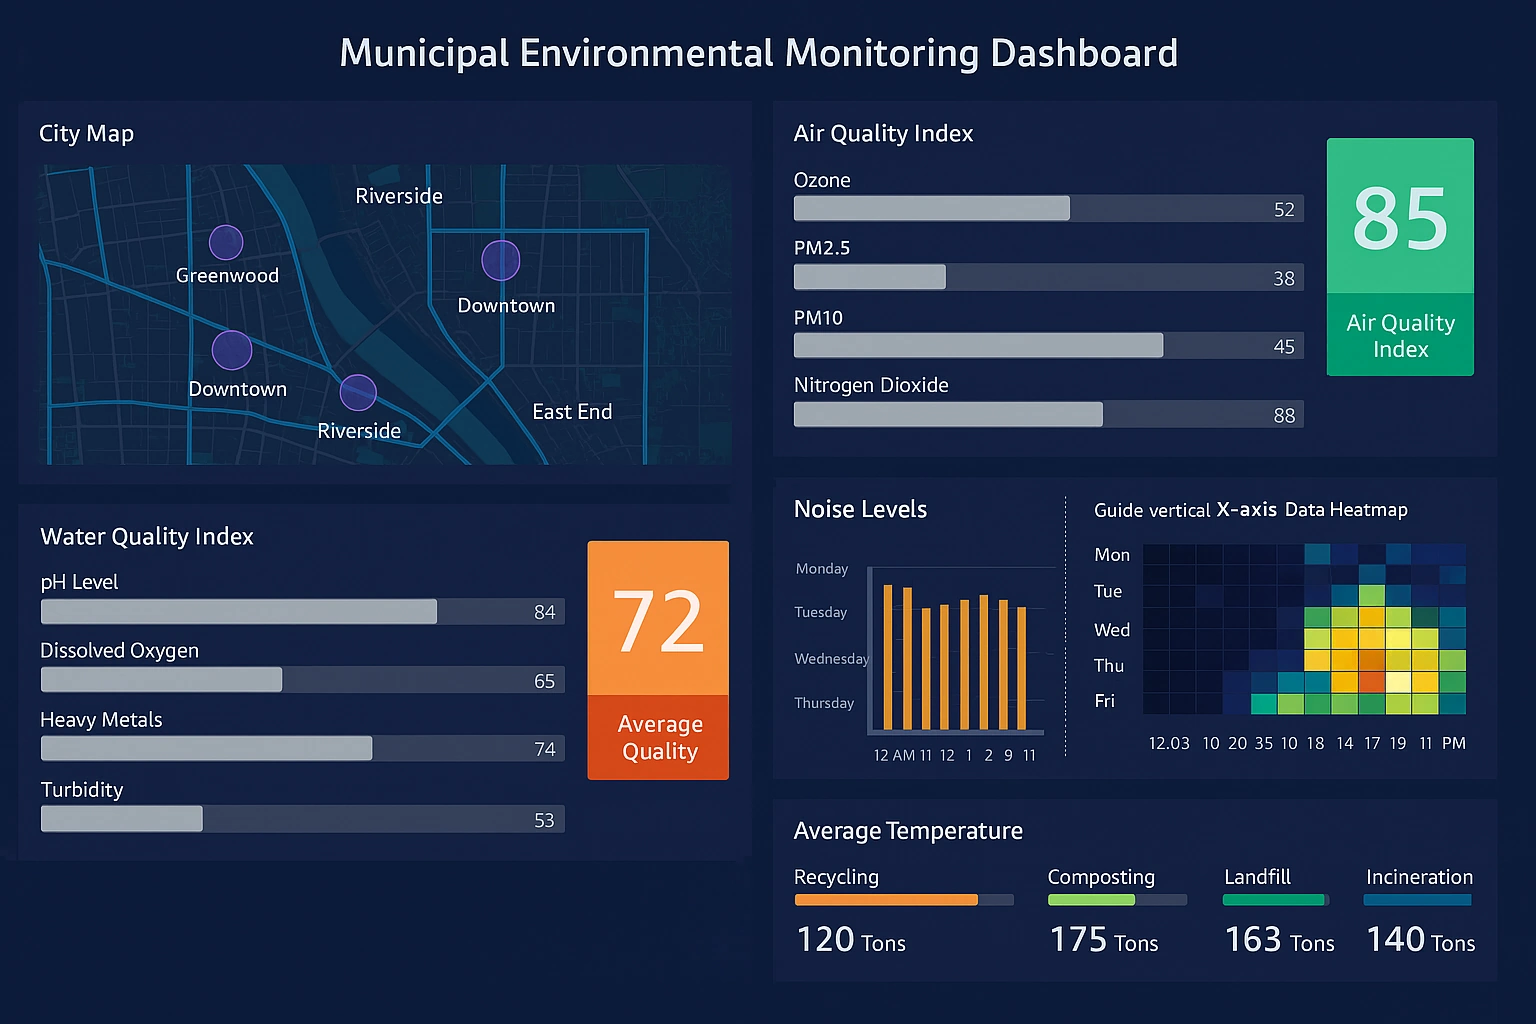
Comparison: Open Source vs Proprietary Reporting Tools
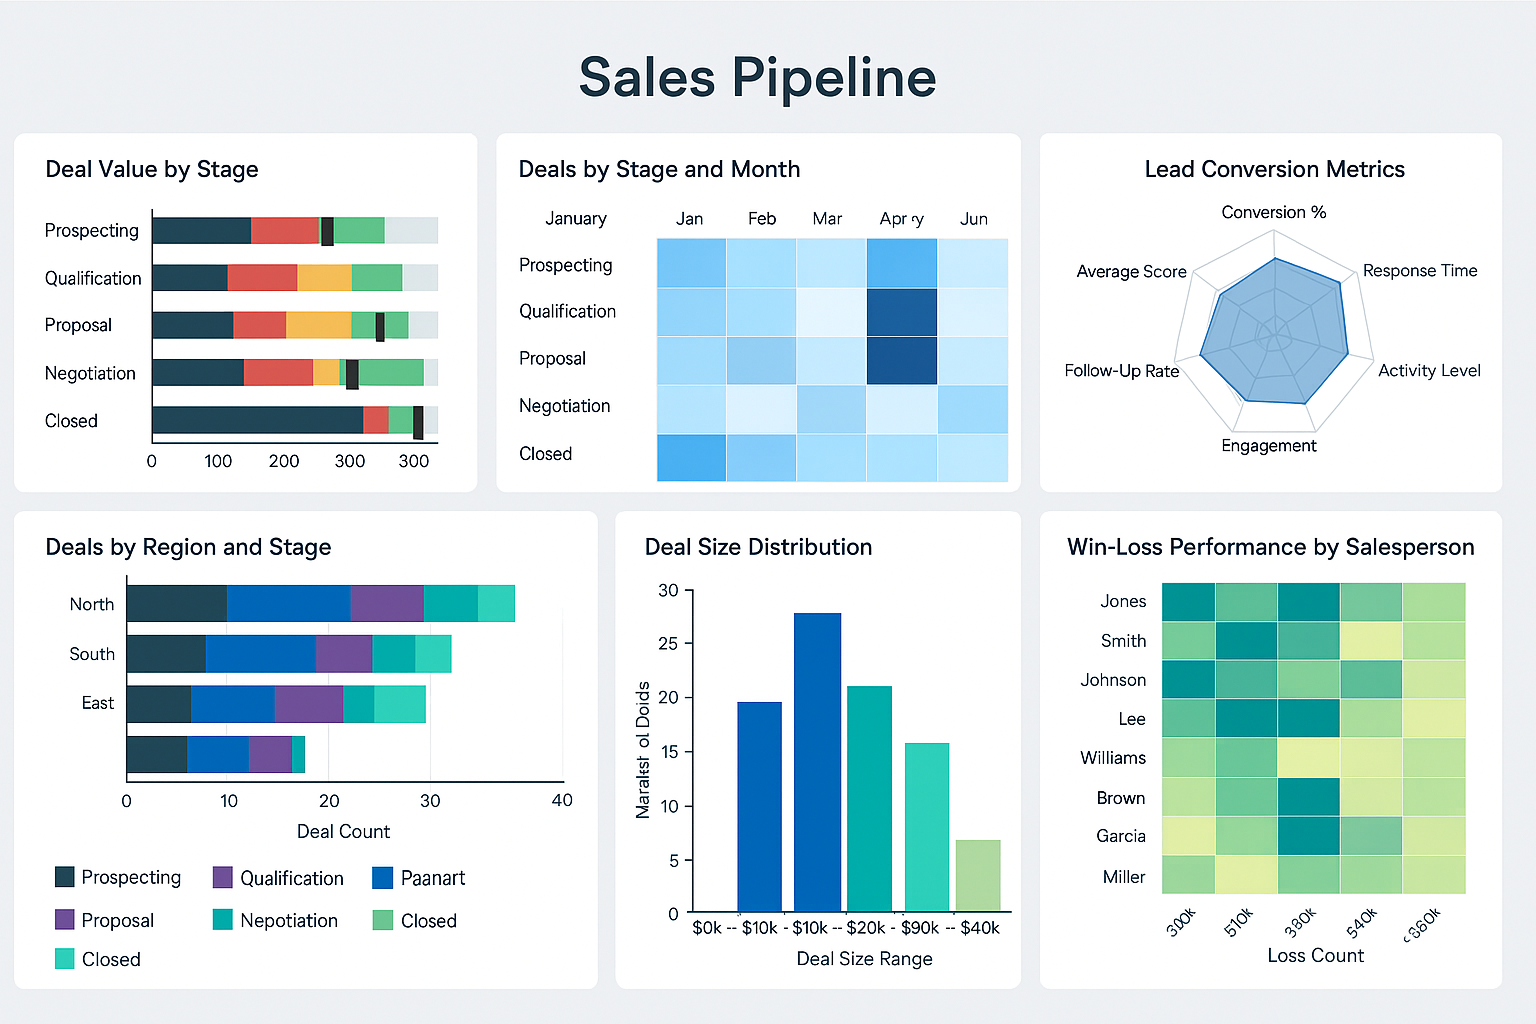
When Open Source Reporting Tools Are the Best Choice
Open source reporting tools are ideal when your organization needs:
- Custom reporting logic beyond what commercial tools allow
- Self-hosted deployments for security or compliance
- Budget-friendly analytics without per-user fees
- Deep integration with internal systems
- Full control over data pipelines and visualization layers
They are especially popular in engineering-heavy teams, SaaS companies, and organizations with strict data governance requirements.
Key Capabilities to Look For
When evaluating open source reporting tools, prioritize:
- Data connectivity (SQL, NoSQL, APIs, cloud warehouses)
- Report designer flexibility (templates, drag-and-drop, scripting)
- Dashboard interactivity (filters, drill-downs, mashups)
- Export formats (PDF, Excel, HTML, CSV)
- Embedding options (iFrames, SDKs, REST APIs)
- Security and access control
- Active community and documentation
These capabilities determine whether a tool can scale from simple reporting to full enterprise analytics.
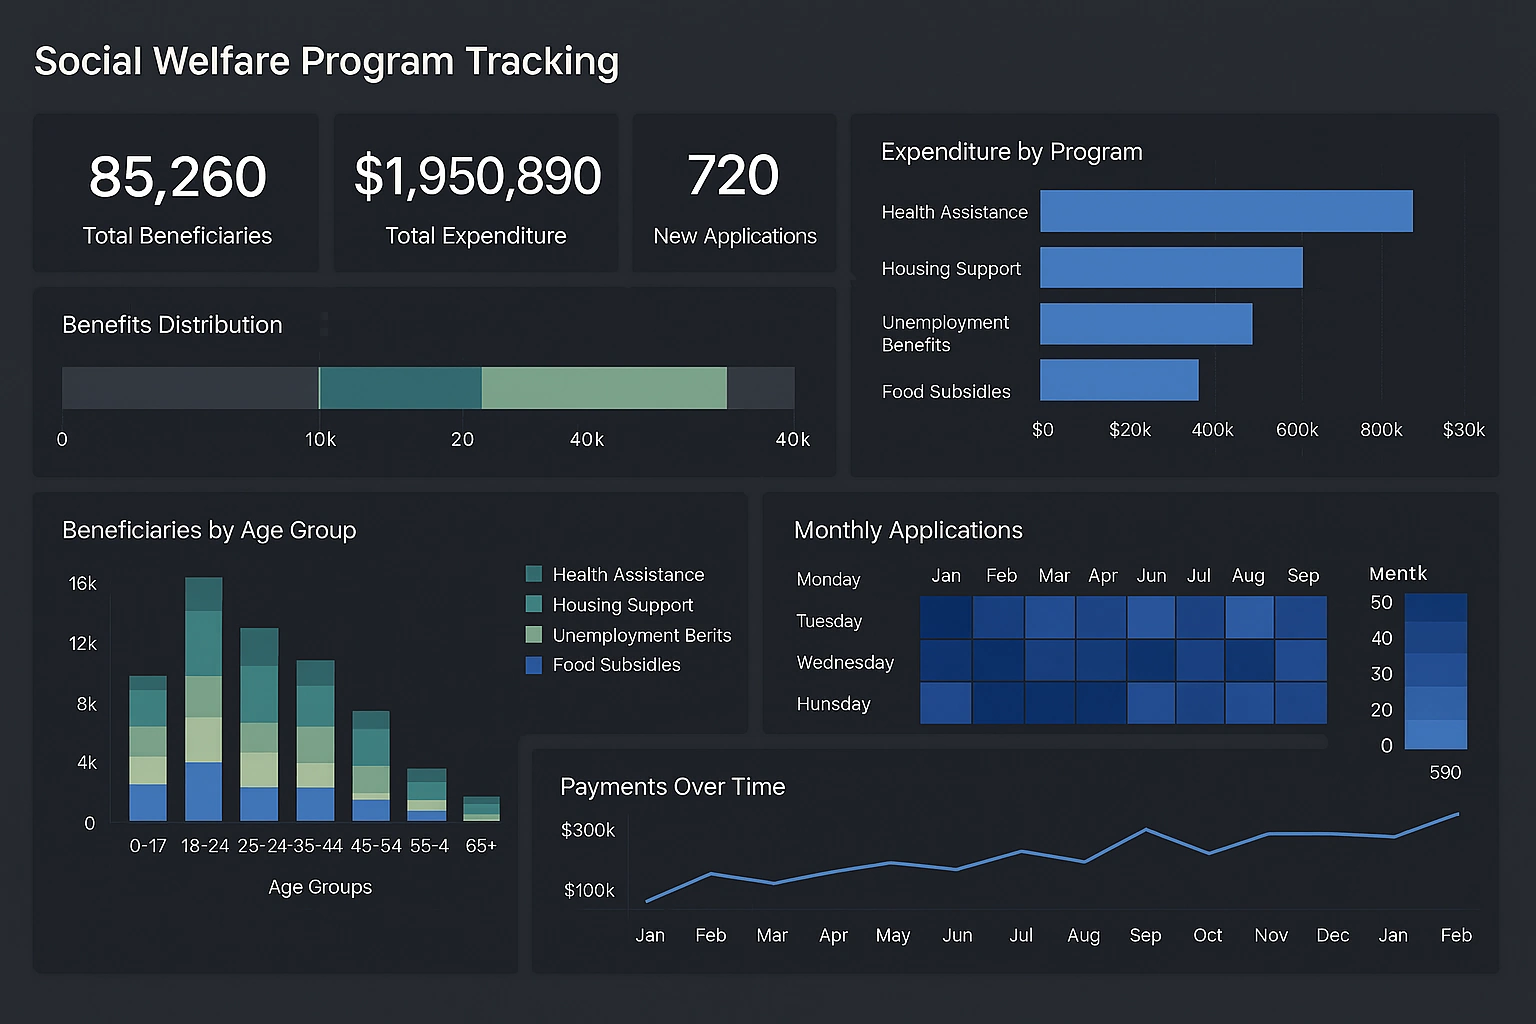
Architecture Considerations
Open source reporting tools typically follow one of three architectures:
1. Standalone Reporting Engines
Generate reports programmatically, often used in application backends (e.g., JasperReports).
2. Full BI Platforms
Provide dashboards, data modeling, and reporting in a single environment (e.g., Metabase, StyleBI).
3. Visualization Frameworks
Focus on charts and dashboards, often for monitoring and time-series data (e.g., Grafana, Redash).
Choosing the right architecture depends on whether your team needs primarily reports, dashboards, or embedded analytics.
Why StyleBI Stands Out
StyleBI’s open source edition offers a blend of flexibility and enterprise capabilities that many teams need from their reporting stack.
- Pixel-perfect reporting
- Interactive dashboards
- Real-time mashup across multiple data sources
- Enterprise-grade security
- Self-service report creation
- Embeddable analytics for SaaS products
It bridges the gap between lightweight open source tools and full enterprise BI platforms.
StyleBI Advantages Compared to Other Open Source Tools
- Multi-source mashup without ETL
- Enterprise-grade row/column-level security
- More advanced data modeling
- Deeper embedding customization
- Drag-and-drop designer for non-developers
- Real-time multi-source mashup
- Modern web-based UI
- Easier SaaS embedding
- Interactive dashboards with drilldowns
- Stronger multi-tenant security
- Faster deployment
- Better cloud-native support
- Business-friendly visualizations beyond time-series
- Data modeling for relational + mixed sources
- More flexible embedding options
- Better suited for BI workflows
- Rich interactive dashboards
- Enterprise security & governance
- Multi-source mashup without SQL stitching
- More scalable for large organizations

FAQ: Open Source Reporting Tools
What are open source reporting tools?
Open source reporting tools are software frameworks that allow teams to design and generate reports using freely available source code, with the ability to customize and self-host.
Are open source reporting tools secure?
Yes, when properly configured. Self-hosting gives organizations full control over data access, authentication, and infrastructure security.
Which open source reporting tools are most popular?
Popular tools include Metabase, StyleBI, JasperReports, BIRT, Grafana, and Redash, each serving different reporting and dashboarding needs.
Can open source tools replace proprietary BI platforms?
For many teams, yes. They offer flexibility, customization, and cost savings, though enterprise support and turnkey features may vary by tool.